


Yirsandy Rodríguez
-
Posts
21 -
Joined
-
Last visited
-
Days Won
1
Content Type
Profiles
Forums
Blogs
Events
News
2026 Kansas City Royals Top Prospects Ranking
Kansas City Royals Videos
Kansas City Royals Free Agent & Trade Rumors, Notes, & Tidbits
Guides & Resources
The Kansas City Royals Players Project
2026 Kansas City Royals Draft Tracker: Picks & Bonuses
Store
Downloads
Gallery
Everything posted by Yirsandy Rodríguez
-
 Image courtesy of © Jay Biggerstaff-Imagn Images Stephen Kolek owns one of the lowest strikeout rates among Kansas City starters. His K% sits at 9.9 against lefties and 10.0 against righties, second-worst in the rotation in both splits. Yet his slider still generates whiffs at a level comparable to some of the best relievers in the league. In 2026, it has produced a 42.7% whiff rate and a 34.1% strikeout rate. Isolated, it belongs in a different profile. A pitch mix is not a collection of stuff but a sequence in which each pitch gives meaning to the next. In 2025, Kolek's sinker and changeup provided that structure. Neither dominated, but both shaped at-bats. The sinker generated ground balls (64.7% GB), while the changeup neutralized lefties (.049 AVG, 26.2% K). Together, they forced hitters to cover the lower half of the zone, opening lanes for the four-seam and slider. In 2026, that foundation is gone. Both pitches have lost their ability to alter swing decisions. The changeup no longer punishes zone contact, and the sinker no longer consistently drives the ball into the ground. Pitch Type Chase% 2025 Chase% 2026 BA 2025 BA 2026 Sinker 24.7% 22.2% .267 .304 Changeup 32.3% 29.6% .049 .310 Without that base, the rest of the arsenal flattens. The four-seam fastball is no longer protected vertically; its ground-ball rate drops from 47.2% to 30.3%, while usage rises to 27.7%. Hitters no longer need to respect the bottom of the zone. Pitch Type Usage 2025 Usage 2026 Whiff% 2026 K% 2026 Sinker 24.1% 22.0% 6 6.6 Changeup 11.6% 12.5% 18.4 16.1 4-Seam 25.6% 27.7% 18.1 7.5 Slider 23.4% 16.8% 42.7 34.1 The slider remains the only elite pitch in the mix. But it no longer shapes at-bats because the pitches surrounding it aren't fooling batters. The slider's usage has declined, and its role as a finishing weapon has lessened. Kolek's start against Tampa Bay made it visible. Three runs in the second inning, 42 pitches to escape it. The problem was not execution, but duration. No at-bat was forced into early commitment. The results by times through the order confirm the pattern: TTO FIP AVG SLG HardHit% 1st Time 3.82 .250 .408 34.9 2nd Time 4.51 .243 .392 23.0 3rd Time 6.11 .298 .574 46.2 Each pass through the lineup strips another layer of flexibility. By the third time, hitters are no longer predicting a sequence; they are attacking isolated pitches. Without sinker or changeup-shaped counts, the four-seam becomes predictable, and the slider becomes detached. The mix stops functioning, weakening all of Kolek's offerings. In the end, the data does not describe a decline in stuff. It describes a pitch mix that no longer forces decisions. And when that happens, the outcome is already simplified before the pitch is thrown. Kolek still has a dominant weapon, but he no longer has a working system. View full article
 -
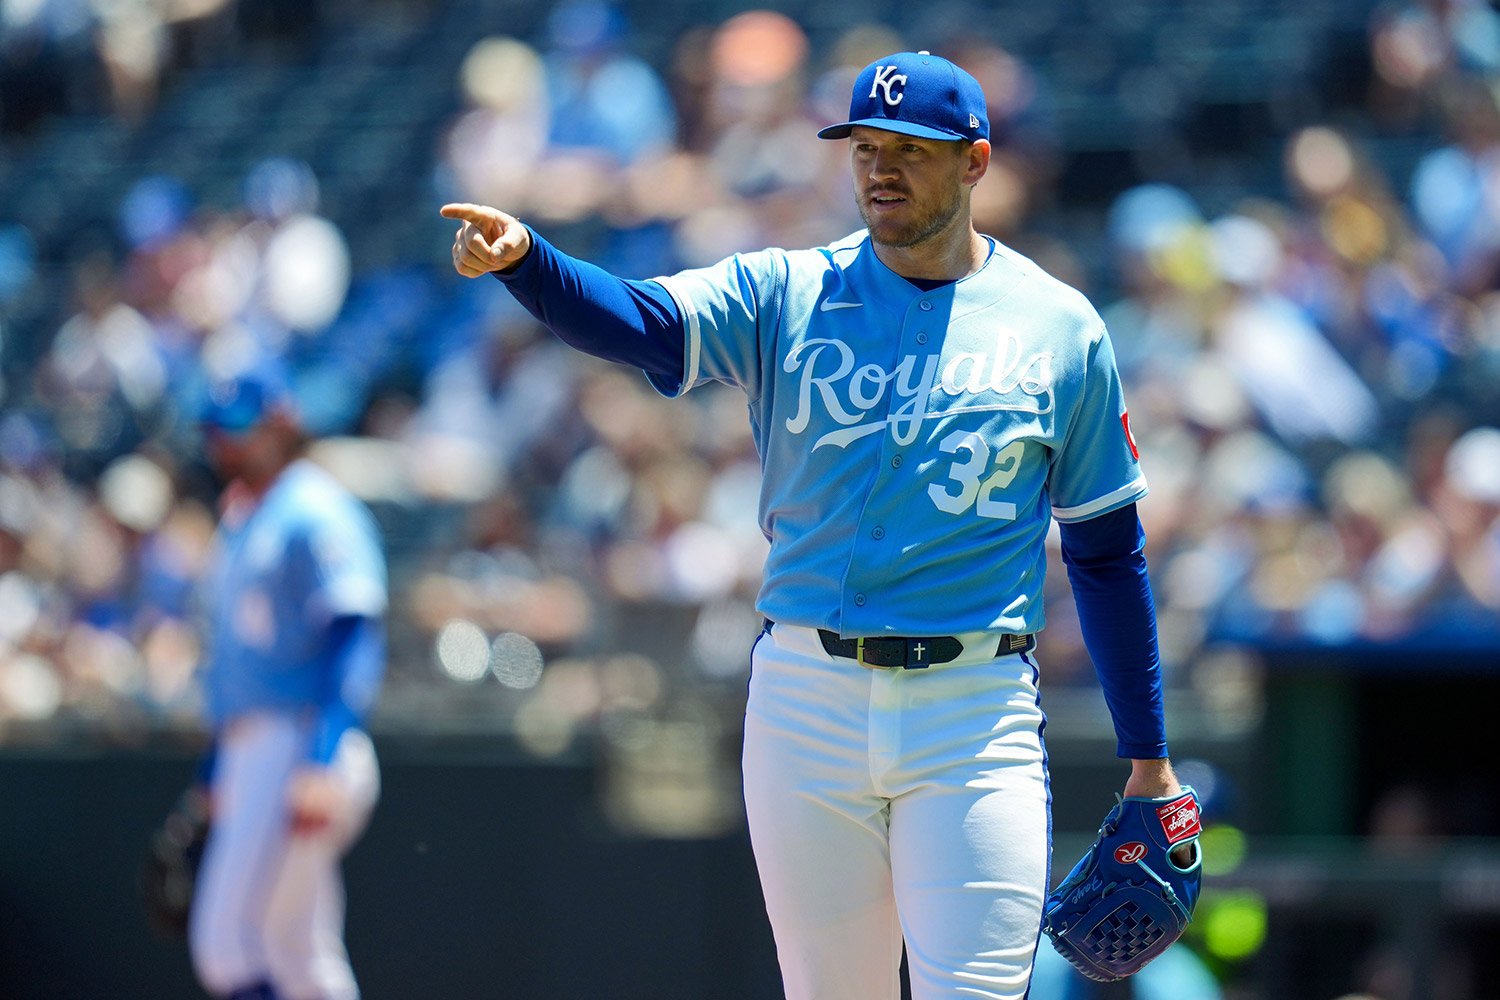 Stephen Kolek owns one of the lowest strikeout rates among Kansas City starters. His K% sits at 9.9 against lefties and 10.0 against righties, second-worst in the rotation in both splits. Yet his slider still generates whiffs at a level comparable to some of the best relievers in the league. In 2026, it has produced a 42.7% whiff rate and a 34.1% strikeout rate. Isolated, it belongs in a different profile. A pitch mix is not a collection of stuff but a sequence in which each pitch gives meaning to the next. In 2025, Kolek's sinker and changeup provided that structure. Neither dominated, but both shaped at-bats. The sinker generated ground balls (64.7% GB), while the changeup neutralized lefties (.049 AVG, 26.2% K). Together, they forced hitters to cover the lower half of the zone, opening lanes for the four-seam and slider. In 2026, that foundation is gone. Both pitches have lost their ability to alter swing decisions. The changeup no longer punishes zone contact, and the sinker no longer consistently drives the ball into the ground. Pitch Type Chase% 2025 Chase% 2026 BA 2025 BA 2026 Sinker 24.7% 22.2% .267 .304 Changeup 32.3% 29.6% .049 .310 Without that base, the rest of the arsenal flattens. The four-seam fastball is no longer protected vertically; its ground-ball rate drops from 47.2% to 30.3%, while usage rises to 27.7%. Hitters no longer need to respect the bottom of the zone. Pitch Type Usage 2025 Usage 2026 Whiff% 2026 K% 2026 Sinker 24.1% 22.0% 6 6.6 Changeup 11.6% 12.5% 18.4 16.1 4-Seam 25.6% 27.7% 18.1 7.5 Slider 23.4% 16.8% 42.7 34.1 The slider remains the only elite pitch in the mix. But it no longer shapes at-bats because the pitches surrounding it aren't fooling batters. The slider's usage has declined, and its role as a finishing weapon has lessened. Kolek's start against Tampa Bay made it visible. Three runs in the second inning, 42 pitches to escape it. The problem was not execution, but duration. No at-bat was forced into early commitment. The results by times through the order confirm the pattern: TTO FIP AVG SLG HardHit% 1st Time 3.82 .250 .408 34.9 2nd Time 4.51 .243 .392 23.0 3rd Time 6.11 .298 .574 46.2 Each pass through the lineup strips another layer of flexibility. By the third time, hitters are no longer predicting a sequence; they are attacking isolated pitches. Without sinker or changeup-shaped counts, the four-seam becomes predictable, and the slider becomes detached. The mix stops functioning, weakening all of Kolek's offerings. In the end, the data does not describe a decline in stuff. It describes a pitch mix that no longer forces decisions. And when that happens, the outcome is already simplified before the pitch is thrown. Kolek still has a dominant weapon, but he no longer has a working system.
 -
Image courtesy of © Jay Biggerstaff-Imagn Images Noah Cameron has a problem, and it isn't his curveball. It's everything around it. His curve remains one of the five most effective breaking pitches in baseball, but it has become the only pitch in his arsenal that hitters still have to respect. Over the past two seasons, Cameron's curveball has struck out 40.1% of the hitters who have faced it while allowing just a .165 batting average, a .224 slugging percentage, and a .210 wOBA. It has performed at the same level as Ranger Suárez's and Joey Cantillo's. It's the kind of pitch any starter would want as the foundation of his repertoire. It's also the only pitch in his arsenal that has maintained that level of performance. That has changed the way hitters attack him. In 2025, hitters chased 32.2% of Cameron's curveballs thrown outside the strike zone. The pitch generated a 37.4% whiff rate and produced a Run Value of +2.7 per 100 pitches. In 2026, those numbers have moved in the opposite direction. His O-Swing rate has fallen to 25.7%, the whiff rate has dropped to 29.5%, and the pitch now carries a Run Value of -0.3 per 100 pitches. Metric 2025 2026 Change O-Swing% 32.20% 25.70% -6.5 pp Whiff% 37.40% 29.50% -7.9 pp Run Value/100 2.7 -0.3 -3 The pitch itself has barely changed. Its velocity, vertical movement, and spin profile have remained almost identical. What changed was the hitters’ response. They’re no longer chasing it at the same rate. One plausible explanation is that the rest of Cameron’s arsenal no longer poses enough of a threat to force hitters to protect the zone early in the count. The rest of his arsenal supports that theory. None of his other pitches has complemented the curveball with any consistency. His four-seam fastball has allowed a 49.3% HardHit rate and a .280 batting average. The cutter hasn’t provided a reliable alternative either, surrendering a .338 average, while both the slider and sinker have been hit even harder. Combined, those four pitches account for 61.5% of Cameron’s repertoire, compared to just 16.8% for his curveball. The results suggest hitters can afford to wait for something more hittable instead of protecting against his best pitch. His pitch usage by count tells the same story. When ahead, Cameron throws his curveball 7.1% of the time and allows just a .084 batting average against it. That’s exactly the type of pitch a starter wants to finish an at-bat. When he falls behind, however, the curveball nearly disappears, dropping to just 2.3% usage, while his repertoire shifts toward fastballs, against which opponents are batting .329. Situation AVG vs. Curveball AVG vs. Fastballs Pitcher Ahead .084 .167 Pitcher Behind .211 .329 That split is unlikely to be a coincidence. It illustrates how Cameron's pitch mix changes once he loses control of the count. The issue isn't that he relies too little on the curveball when ahead—it remains dominant in those situations. The challenge comes when he has to lean on the rest of his arsenal to regain leverage in the count. At the same time, Cameron has improved in several important areas. His strikeout rate has climbed from the 55th percentile to the 82nd, while his walk rate has improved from the 33rd to the 75th. He's commanding the strike zone more effectively and generating more swings and misses overall. The quality of contact, however, has moved sharply in the opposite direction. His Hard Hit percentile has fallen from the 82nd to the 48th, his Barrel percentile from the 73rd to the 24th, and the Run Value of his breaking pitches from the 99th to the 21st. Hitters aren't just making more contact; they're doing far more damage when they connect. The lack of a reliable second pitch helps explain that pattern. The slider is the clearest example. In 2025, it held hitters to a .205 batting average and a .256 slugging percentage while generating a 31.1% whiff rate. One year later, those numbers have climbed to .300 and .550, prompting Cameron to reduce its usage from 14.1% to 9.6%. The sinker hasn't offered an answer either, allowing a .636 batting average. His changeup, meanwhile, has been his second-most effective pitch, producing just a 24.1% HardHit rate, and it may represent his best option for bringing more balance to the repertoire. Noah Cameron's curveball has never stopped being an elite pitch. What has changed is everything around it. Until the rest of his repertoire forces hitters to respect more than one weapon, his curveball will continue carrying a burden no single pitch can shoulder on its own. View full article
-
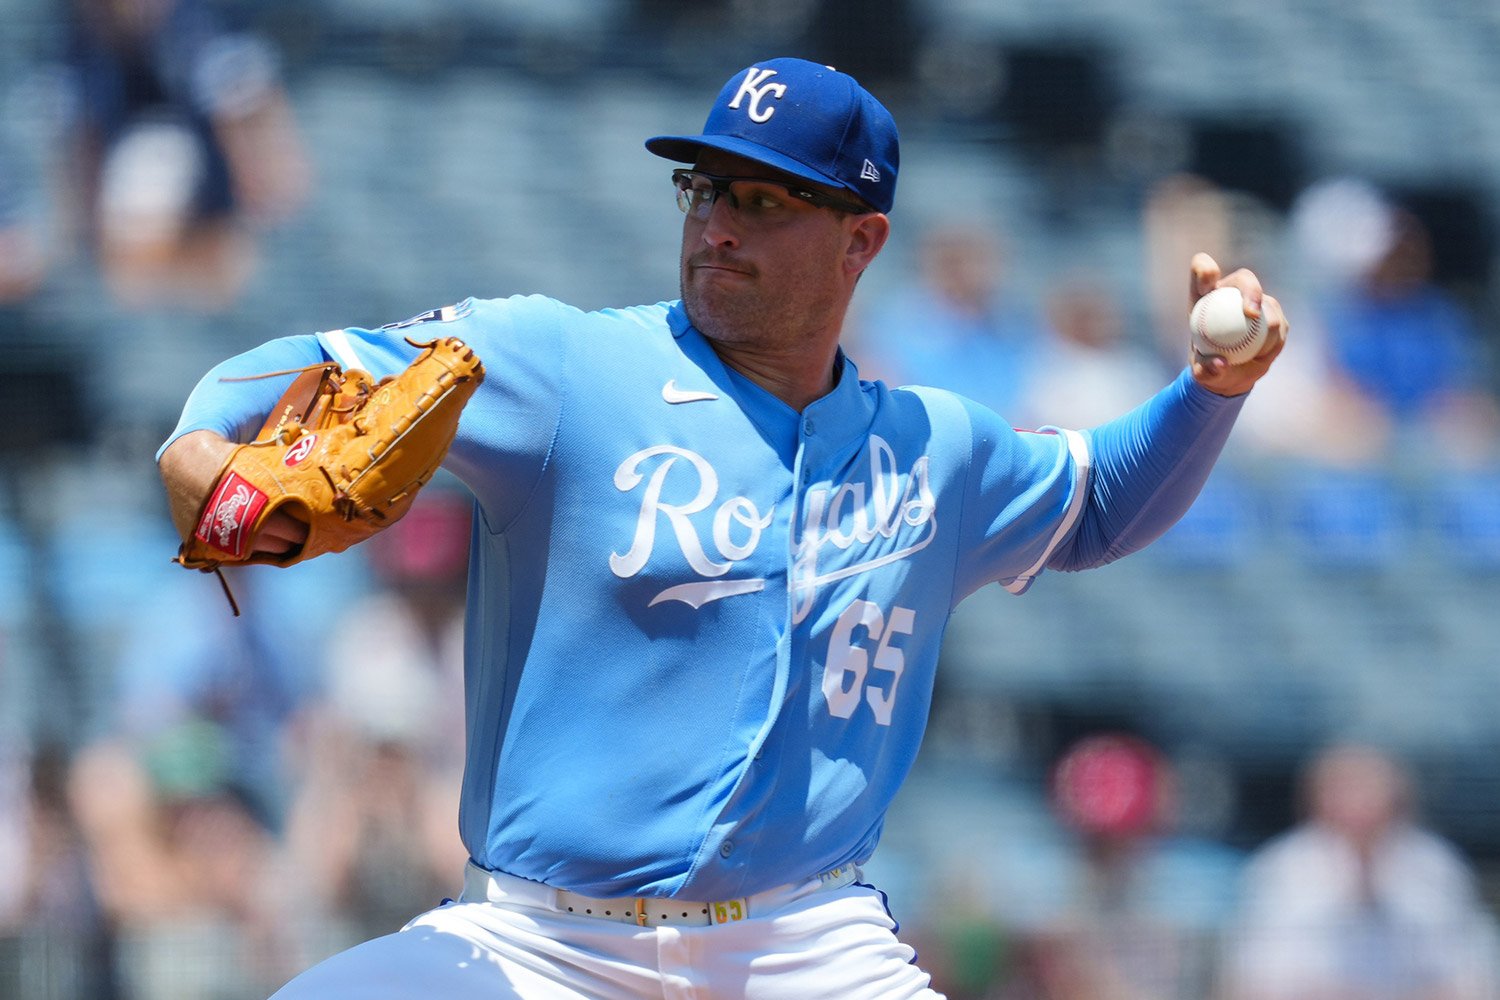 Noah Cameron has a problem, and it isn't his curveball. It's everything around it. His curve remains one of the five most effective breaking pitches in baseball, but it has become the only pitch in his arsenal that hitters still have to respect. Over the past two seasons, Cameron's curveball has struck out 40.1% of the hitters who have faced it while allowing just a .165 batting average, a .224 slugging percentage, and a .210 wOBA. It has performed at the same level as Ranger Suárez's and Joey Cantillo's. It's the kind of pitch any starter would want as the foundation of his repertoire. It's also the only pitch in his arsenal that has maintained that level of performance. That has changed the way hitters attack him. In 2025, hitters chased 32.2% of Cameron's curveballs thrown outside the strike zone. The pitch generated a 37.4% whiff rate and produced a Run Value of +2.7 per 100 pitches. In 2026, those numbers have moved in the opposite direction. His O-Swing rate has fallen to 25.7%, the whiff rate has dropped to 29.5%, and the pitch now carries a Run Value of -0.3 per 100 pitches. Metric 2025 2026 Change O-Swing% 32.20% 25.70% -6.5 pp Whiff% 37.40% 29.50% -7.9 pp Run Value/100 2.7 -0.3 -3 The pitch itself has barely changed. Its velocity, vertical movement, and spin profile have remained almost identical. What changed was the hitters’ response. They’re no longer chasing it at the same rate. One plausible explanation is that the rest of Cameron’s arsenal no longer poses enough of a threat to force hitters to protect the zone early in the count. The rest of his arsenal supports that theory. None of his other pitches has complemented the curveball with any consistency. His four-seam fastball has allowed a 49.3% HardHit rate and a .280 batting average. The cutter hasn’t provided a reliable alternative either, surrendering a .338 average, while both the slider and sinker have been hit even harder. Combined, those four pitches account for 61.5% of Cameron’s repertoire, compared to just 16.8% for his curveball. The results suggest hitters can afford to wait for something more hittable instead of protecting against his best pitch. His pitch usage by count tells the same story. When ahead, Cameron throws his curveball 7.1% of the time and allows just a .084 batting average against it. That’s exactly the type of pitch a starter wants to finish an at-bat. When he falls behind, however, the curveball nearly disappears, dropping to just 2.3% usage, while his repertoire shifts toward fastballs, against which opponents are batting .329. Situation AVG vs. Curveball AVG vs. Fastballs Pitcher Ahead .084 .167 Pitcher Behind .211 .329 That split is unlikely to be a coincidence. It illustrates how Cameron's pitch mix changes once he loses control of the count. The issue isn't that he relies too little on the curveball when ahead—it remains dominant in those situations. The challenge comes when he has to lean on the rest of his arsenal to regain leverage in the count. At the same time, Cameron has improved in several important areas. His strikeout rate has climbed from the 55th percentile to the 82nd, while his walk rate has improved from the 33rd to the 75th. He's commanding the strike zone more effectively and generating more swings and misses overall. The quality of contact, however, has moved sharply in the opposite direction. His Hard Hit percentile has fallen from the 82nd to the 48th, his Barrel percentile from the 73rd to the 24th, and the Run Value of his breaking pitches from the 99th to the 21st. Hitters aren't just making more contact; they're doing far more damage when they connect. The lack of a reliable second pitch helps explain that pattern. The slider is the clearest example. In 2025, it held hitters to a .205 batting average and a .256 slugging percentage while generating a 31.1% whiff rate. One year later, those numbers have climbed to .300 and .550, prompting Cameron to reduce its usage from 14.1% to 9.6%. The sinker hasn't offered an answer either, allowing a .636 batting average. His changeup, meanwhile, has been his second-most effective pitch, producing just a 24.1% HardHit rate, and it may represent his best option for bringing more balance to the repertoire. Noah Cameron's curveball has never stopped being an elite pitch. What has changed is everything around it. Until the rest of his repertoire forces hitters to respect more than one weapon, his curveball will continue carrying a burden no single pitch can shoulder on its own.
 -
Image courtesy of © Peter Aiken-Imagn Images When the Royals signed Lane Thomas, they weren't looking for a superstar. They wanted a dependable two-way outfielder, the player who hit 28 home runs, stole 20 bases, and posted a 109 wRC+ with the Nationals just two seasons earlier at age 27. That version of Thomas has yet to show up in Kansas City. Season Team AVG OBP SLG OPS ISO HR SB wRC+ 2023 WSN .268 .315 .468 .783 .201 28 20 109 2026 KCR .217 .327 .339 .666 .122 5 4 89 His .217/.327/.339 slash line and 89 wRC+ tell the story of an offense that has fallen well short of expectations. Injuries explain part of it. Between 2024 and 2025, Thomas dealt with a left MCL sprain, a bone bruise fracture in his right wrist, and plantar fasciitis that eventually required surgery. The numbers, however, suggest the root of his disappointing season goes well beyond time spent on the injured list. At first glance, several indicators point in the right direction. Thomas has never walked more often, posting a career-high 13.5% walk rate compared to his 8.5% career average. He's also cut his strikeout rate to 22.0%—the second-lowest mark of his career—and is chasing pitches outside the strike zone less than at any previous point in his career. Metric 2023 (WSN) 2024 2025 2026 (KCR) BB% 5.3% 8.3% 9.9% 13.5% K% 25.8% 25.9% 31.0% 22.0% That's usually the profile of a hitter with better pitch recognition, improved swing decisions, and more favorable counts. More often than not, that process leads to better offensive production. For Thomas, the opposite has happened. That raises a more interesting question: How can a hitter make better decisions at the plate while becoming less dangerous? That contradiction defines his 2026 season. The biggest drop comes once he makes contact. Power Metric 2023 (WSN) 2024 2025 2026 (KCR) ISO 20.1% 16.3% 11.2% 12.2% Barrel% 9.6% 7.4% 4.8% 4.2% HR/FB% 16.4% 10.9% 9.3% 8.2% His .122 ISO is the second-lowest of his career, while his .339 slugging percentage sits well below the levels he reached during his best seasons. Even more concerning, his 4.2% barrel rate is a career low, and only 8.2% of his fly balls have left the yard. Thomas is earning better counts and wasting fewer plate appearances, but he no longer turns those advantages into impactful contact. The injuries may have contributed to that change, especially after the issues involving his knee, wrist, and foot. The metrics now point somewhere else: the way he's generating contact. His 72.1 mph bat speed remains above the MLB average, yet his ability to produce optimal launch angles has declined for three straight seasons, with his Blast Rate dropping from 15.3% in 2024 to 10.2% in 2026. Statcast tells the same story. His Square-Up rate has improved from 2025 but remains well below the level he reached during his best offensive years. His .263 BABIP and .239 xBA also leave little room to blame bad luck. Thomas is still recognizing pitches. He just isn't producing the kind of contact that consistently turns into extra-base hits. The problems don't end at the plate. Thomas has also become a defensive liability, posting a -5 Outs Above Average and -2.1 defensive value in just 71 games. Even center field, once his best position, has slipped to -2 OAA. The diagnosis is clear. But is there a path back? If Thomas is going to rediscover the player who hit 28 home runs in 2023, he'll need to rebuild his swing mechanics. His 72.1 mph bat speed is virtually unchanged from that season's 71.8 mph, but his Tilt has dropped from 29 degrees to 27 degrees, his Swing Path has flattened, and his Blast Rate has fallen from 16.2% to 10.2%. The issue isn't strength or pitch recognition. It's a swing that no longer creates the attack angle needed to turn good swing decisions into power. Lane Thomas hasn't lost his ability to recognize pitches or the bat speed needed to remain a productive hitter. What he's lost is the swing that once turned good swing decisions into damage. Until he regains that attack angle, the Royals will keep waiting for the player they thought they had acquired—a player who, for now, exists only in the memory of his 2023 season. View full article
-
What's Behind Lane Thomas' Disappointing Season With The Royals
Yirsandy Rodríguez posted an article in Royals
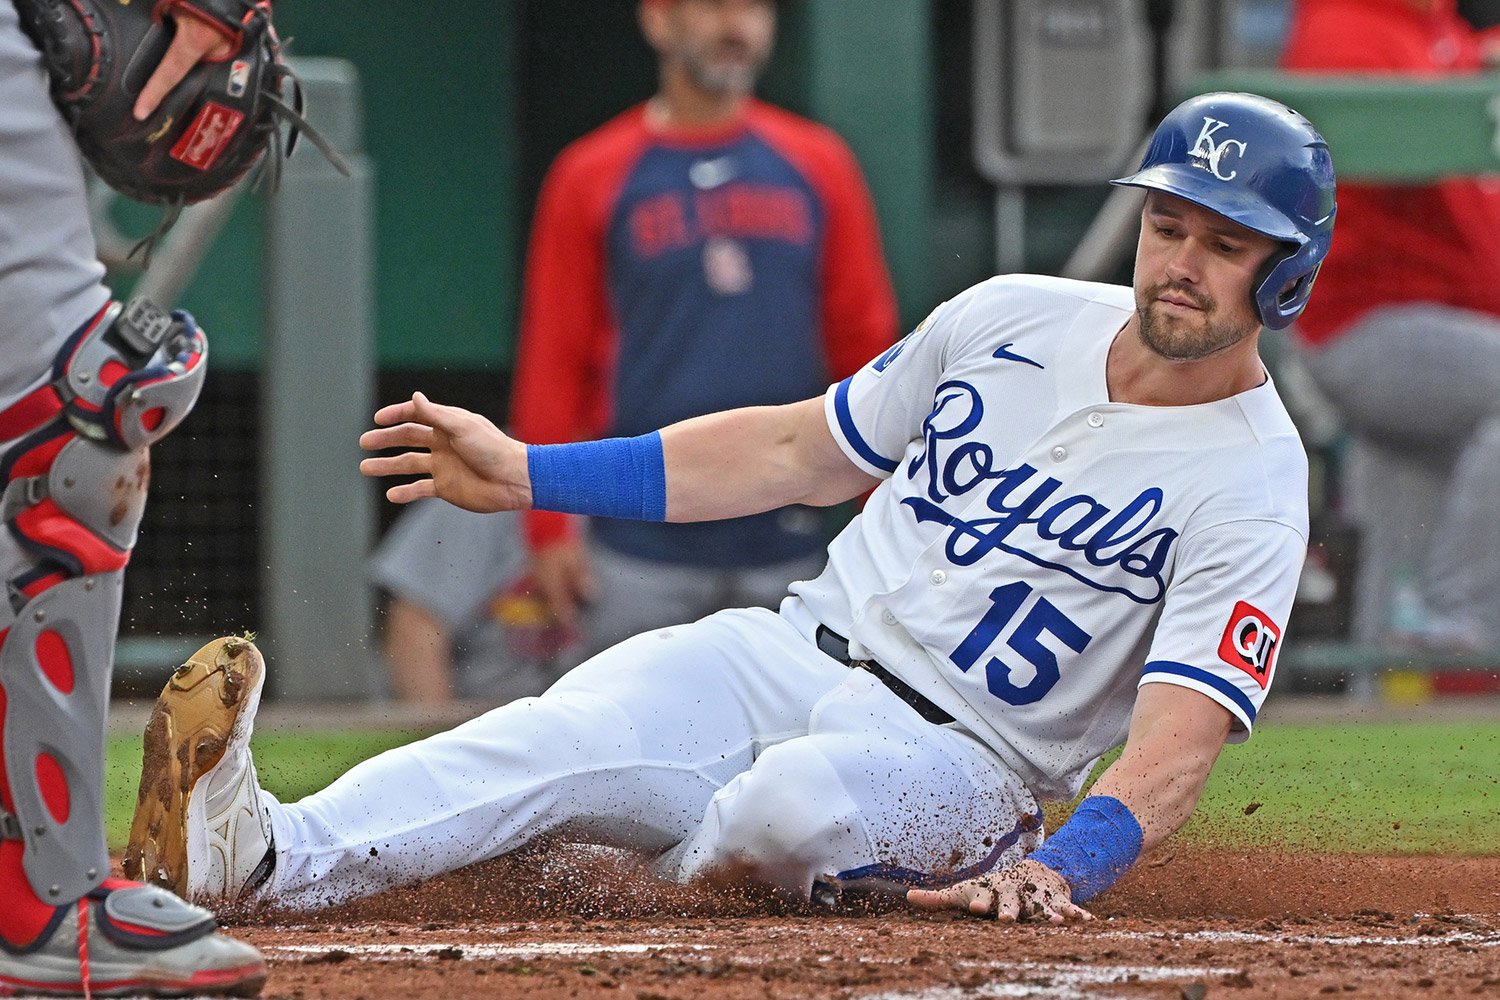 When the Royals signed Lane Thomas, they weren't looking for a superstar. They wanted a dependable two-way outfielder, the player who hit 28 home runs, stole 20 bases, and posted a 109 wRC+ with the Nationals just two seasons earlier at age 27. That version of Thomas has yet to show up in Kansas City. Season Team AVG OBP SLG OPS ISO HR SB wRC+ 2023 WSN .268 .315 .468 .783 .201 28 20 109 2026 KCR .217 .327 .339 .666 .122 5 4 89 His .217/.327/.339 slash line and 89 wRC+ tell the story of an offense that has fallen well short of expectations. Injuries explain part of it. Between 2024 and 2025, Thomas dealt with a left MCL sprain, a bone bruise fracture in his right wrist, and plantar fasciitis that eventually required surgery. The numbers, however, suggest the root of his disappointing season goes well beyond time spent on the injured list. At first glance, several indicators point in the right direction. Thomas has never walked more often, posting a career-high 13.5% walk rate compared to his 8.5% career average. He's also cut his strikeout rate to 22.0%—the second-lowest mark of his career—and is chasing pitches outside the strike zone less than at any previous point in his career. Metric 2023 (WSN) 2024 2025 2026 (KCR) BB% 5.3% 8.3% 9.9% 13.5% K% 25.8% 25.9% 31.0% 22.0% That's usually the profile of a hitter with better pitch recognition, improved swing decisions, and more favorable counts. More often than not, that process leads to better offensive production. For Thomas, the opposite has happened. That raises a more interesting question: How can a hitter make better decisions at the plate while becoming less dangerous? That contradiction defines his 2026 season. The biggest drop comes once he makes contact. Power Metric 2023 (WSN) 2024 2025 2026 (KCR) ISO 20.1% 16.3% 11.2% 12.2% Barrel% 9.6% 7.4% 4.8% 4.2% HR/FB% 16.4% 10.9% 9.3% 8.2% His .122 ISO is the second-lowest of his career, while his .339 slugging percentage sits well below the levels he reached during his best seasons. Even more concerning, his 4.2% barrel rate is a career low, and only 8.2% of his fly balls have left the yard. Thomas is earning better counts and wasting fewer plate appearances, but he no longer turns those advantages into impactful contact. The injuries may have contributed to that change, especially after the issues involving his knee, wrist, and foot. The metrics now point somewhere else: the way he's generating contact. His 72.1 mph bat speed remains above the MLB average, yet his ability to produce optimal launch angles has declined for three straight seasons, with his Blast Rate dropping from 15.3% in 2024 to 10.2% in 2026. Statcast tells the same story. His Square-Up rate has improved from 2025 but remains well below the level he reached during his best offensive years. His .263 BABIP and .239 xBA also leave little room to blame bad luck. Thomas is still recognizing pitches. He just isn't producing the kind of contact that consistently turns into extra-base hits. The problems don't end at the plate. Thomas has also become a defensive liability, posting a -5 Outs Above Average and -2.1 defensive value in just 71 games. Even center field, once his best position, has slipped to -2 OAA. The diagnosis is clear. But is there a path back? If Thomas is going to rediscover the player who hit 28 home runs in 2023, he'll need to rebuild his swing mechanics. His 72.1 mph bat speed is virtually unchanged from that season's 71.8 mph, but his Tilt has dropped from 29 degrees to 27 degrees, his Swing Path has flattened, and his Blast Rate has fallen from 16.2% to 10.2%. The issue isn't strength or pitch recognition. It's a swing that no longer creates the attack angle needed to turn good swing decisions into power. Lane Thomas hasn't lost his ability to recognize pitches or the bat speed needed to remain a productive hitter. What he's lost is the swing that once turned good swing decisions into damage. Until he regains that attack angle, the Royals will keep waiting for the player they thought they had acquired—a player who, for now, exists only in the memory of his 2023 season.
 -
Image courtesy of © William Purnell-Imagn Images Carter Jensen's 16-game hitting streak isn't the story. The story is what happened before it. What changed for a hitter who endured one of his worst offensive months in May to suddenly own the longest active hitting streak in the majors? He answered the first adjustment major league pitchers made against him. Jensen spent April punishing fastballs, posting a .602 expected slugging percentage (xSLG) against them in 52 plate appearances. The league adjusted quickly. Rather than challenging him with velocity, pitchers shifted toward breaking balls and offspeed pitches, forcing him to prove he could produce once his best pitch disappeared. That approach worked in May. Breaking balls became the centerpiece of every game plan. Jensen hit just .116 against breaking balls and offspeed pitches combined, and 58% of his strikeouts came against those offerings. His production collapsed because pitchers dictated the terms of the at-bat instead of allowing him to attack pitches he handled best. The important question wasn't whether Jensen could snap out of a slump. It was a question of whether that weakness would become part of his long-term offensive profile. June has started to answer that question. Carter Jensen Performance vs. Breaking Balls Month AVG SLG Exit Velocity Whiff April .133 .133 87.4 mph 37.5% May .139 .194 87.0 mph 29.2% June .265 .529 94.8 mph 26.7% The numbers point to something more important than a higher batting average. Jensen is making more contact against breaking balls and hitting them much harder. His average exit velocity has jumped by nearly eight mph, while his whiff rate has continued to fall. The pitch that controlled his at-bats a month ago is no longer producing the same outcome. Pitchers haven’t abandoned their plan, either. They’re actually throwing Jensen more offspeed pitches than they did in May. He’s responded by cutting his whiff rate against those pitches from 42.1% to 14.3%. He’s also gone 3-for-11 against them this month, and every hit has gone for extra bases—two doubles and a home run. His average exit velocity has climbed from 75.5 mph to 96.6 mph over that span. The sample remains small, but the adjustment is visible. Jensen isn’t succeeding because pitchers have changed their approach. He’s succeeding because he changed his response. Jensen Monthly Offensive Production Month AVG SLG K% wRC+ Mar./Apr. .256 .478 29.1% 124 May .198 .309 28.3% 55 June .277 .518 21.7% 126 That adjustment reaches beyond his production against specific pitch types. Jensen's strikeout rate has dropped by nearly seven percentage points from May to June, a sign that he's losing fewer plate appearances against the pitches that exposed him earlier in the season. Those aren't independent trends. They're different outcomes of the same adjustment. Kansas City has responded, too. The Royals have hit Jensen near the top of the lineup throughout much of June. That's less about rewarding a hitting streak than recognizing better plate appearances. His .359 wOBA and .311 BABIP this month support what the underlying changes already suggest: he's making pitchers work under different conditions than he did just a few weeks ago. That's the value of this hitting streak. It doesn't prove Jensen has solved major league pitching. It doesn't guarantee the league won't find another weakness. It does suggest something every organization wants to see from a young hitter. When major league pitchers identified Jensen's first offensive vulnerability, he adjusted before it became part of his identity. The streak may end tomorrow. That adjustment is what Kansas City should remember. View full article
-
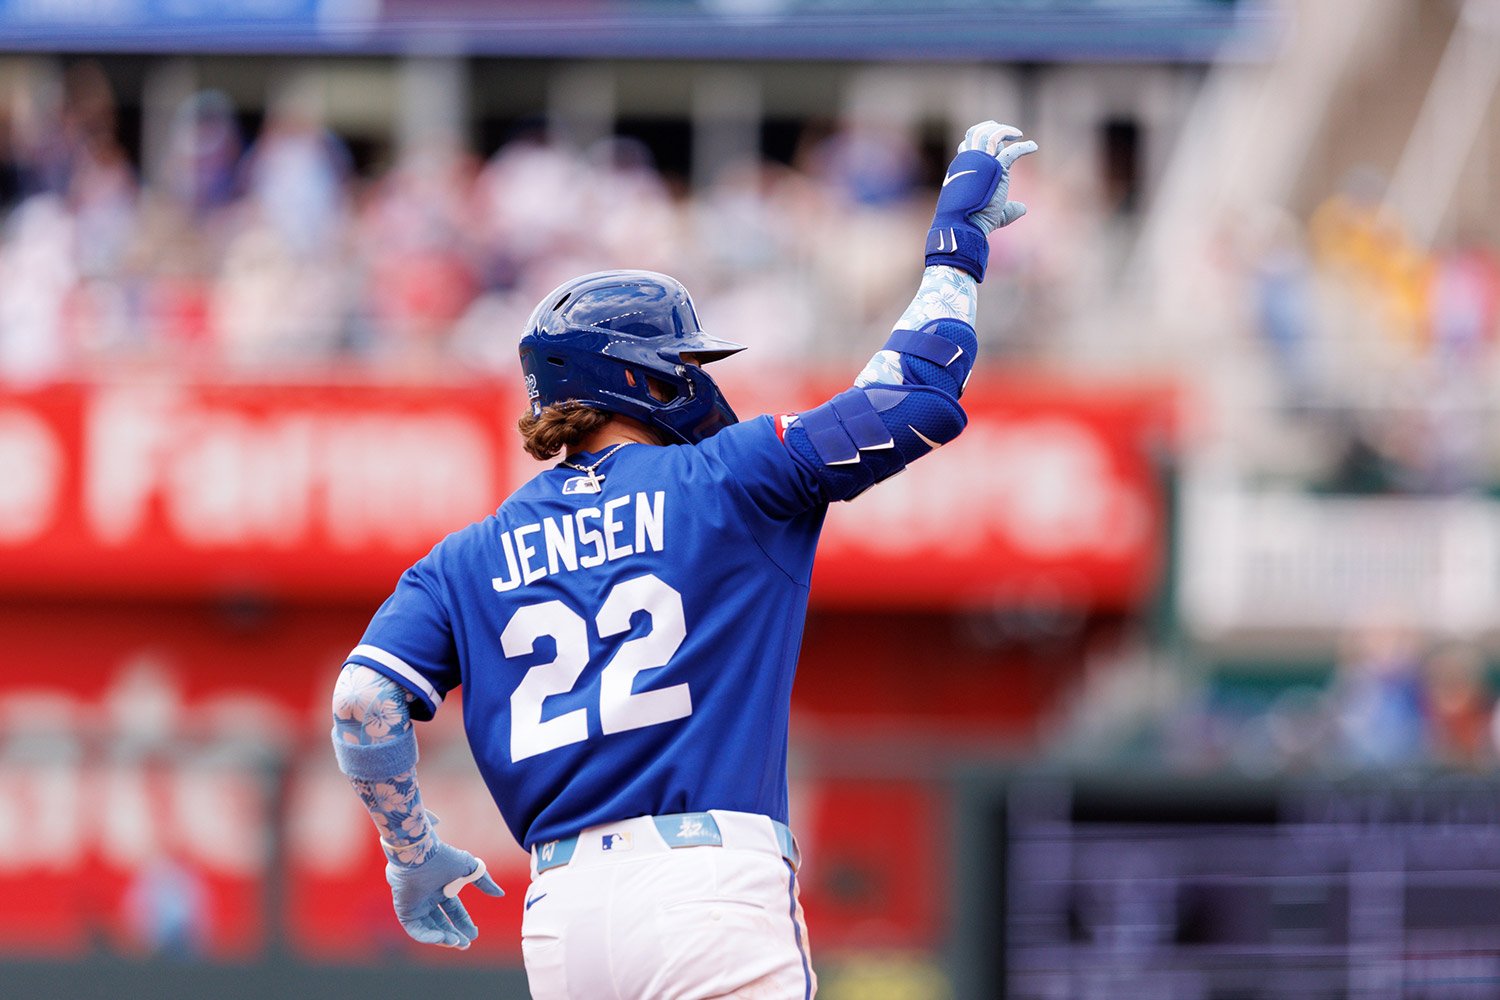 Carter Jensen's 16-game hitting streak isn't the story. The story is what happened before it. What changed for a hitter who endured one of his worst offensive months in May to suddenly own the longest active hitting streak in the majors? He answered the first adjustment major league pitchers made against him. Jensen spent April punishing fastballs, posting a .602 expected slugging percentage (xSLG) against them in 52 plate appearances. The league adjusted quickly. Rather than challenging him with velocity, pitchers shifted toward breaking balls and offspeed pitches, forcing him to prove he could produce once his best pitch disappeared. That approach worked in May. Breaking balls became the centerpiece of every game plan. Jensen hit just .116 against breaking balls and offspeed pitches combined, and 58% of his strikeouts came against those offerings. His production collapsed because pitchers dictated the terms of the at-bat instead of allowing him to attack pitches he handled best. The important question wasn't whether Jensen could snap out of a slump. It was a question of whether that weakness would become part of his long-term offensive profile. June has started to answer that question. Carter Jensen Performance vs. Breaking Balls Month AVG SLG Exit Velocity Whiff April .133 .133 87.4 mph 37.5% May .139 .194 87.0 mph 29.2% June .265 .529 94.8 mph 26.7% The numbers point to something more important than a higher batting average. Jensen is making more contact against breaking balls and hitting them much harder. His average exit velocity has jumped by nearly eight mph, while his whiff rate has continued to fall. The pitch that controlled his at-bats a month ago is no longer producing the same outcome. Pitchers haven’t abandoned their plan, either. They’re actually throwing Jensen more offspeed pitches than they did in May. He’s responded by cutting his whiff rate against those pitches from 42.1% to 14.3%. He’s also gone 3-for-11 against them this month, and every hit has gone for extra bases—two doubles and a home run. His average exit velocity has climbed from 75.5 mph to 96.6 mph over that span. The sample remains small, but the adjustment is visible. Jensen isn’t succeeding because pitchers have changed their approach. He’s succeeding because he changed his response. Jensen Monthly Offensive Production Month AVG SLG K% wRC+ Mar./Apr. .256 .478 29.1% 124 May .198 .309 28.3% 55 June .277 .518 21.7% 126 That adjustment reaches beyond his production against specific pitch types. Jensen's strikeout rate has dropped by nearly seven percentage points from May to June, a sign that he's losing fewer plate appearances against the pitches that exposed him earlier in the season. Those aren't independent trends. They're different outcomes of the same adjustment. Kansas City has responded, too. The Royals have hit Jensen near the top of the lineup throughout much of June. That's less about rewarding a hitting streak than recognizing better plate appearances. His .359 wOBA and .311 BABIP this month support what the underlying changes already suggest: he's making pitchers work under different conditions than he did just a few weeks ago. That's the value of this hitting streak. It doesn't prove Jensen has solved major league pitching. It doesn't guarantee the league won't find another weakness. It does suggest something every organization wants to see from a young hitter. When major league pitchers identified Jensen's first offensive vulnerability, he adjusted before it became part of his identity. The streak may end tomorrow. That adjustment is what Kansas City should remember.
 -
Great points, Kevin. I actually think they fit well with the article's main argument. The focus was on how the Royals have built an elite defensive foundation around Bobby, but that doesn't mean the roster is a finished product. The outfield is probably the biggest area where there's still room to improve. I also agree on Massey. His impact goes beyond the individual plays he makes. He's brought much more stability to second base, and that has helped the entire infield play as a more cohesive unit. If the Royals can add an outfielder who provides both above-average defense and offensive value this offseason, this could become an even better run-prevention team.
- 3 replies
-
- 1
-

-
- bobby witt jr
- kyle isbel
- (and 2 more)
-
Image courtesy of © Denny Medley-Imagn Images When the tying or go-ahead run is standing on second, the Royals' staff has a knack for falling apart in ways that cold, hard numbers, like the 50 homers they've surrendered with runners on base, the most in the majors, barely begin to capture. They've allowed 46.6% of their total runs via the long ball, the second-highest rate in baseball and well above the league-average mark of 39.8%. They've also given up 13 three-run homers, tied for third-most. The trend followed them to Washington in their last series, where six of the fifteen runs they coughed up came on just two swings; both three-run shots. The Strikeout Trap Noah Cameron has been, on paper, one of the more intriguing arms in the system. His slider generates whiffs, and his 18.6% strikeout rate in pressure-packed plate appearances is nothing to dismiss. But when Cameron misses, he misses in the worst possible locations. Across 70 high-leverage trips to the plate, he's allowed five homers, paired with a 15.7% barrel rate and a .552 expected slugging percentage. His heat map tells the whole story: a .696 xwOBA in the upper-middle third, and .452 on the inner half up. When he elevates his fastball or leaves it drifting into the hitter's wheelhouse, the punishment is immediate. Cameron hasn't lost his stuff—his sweeping slider is still nasty—but his arsenal, and particularly a fastball that lacks true vertical ride, is poorly suited for the high-leverage moments he's being thrown into. Michael Wacha sits on the opposite end of the spectrum. He doesn't beat himself with free passes (3.8% walk rate in high-leverage spots), but his fastball averages just 88.4 mph, and hitters know it's coming. His HardHit% in those same clutch situations sits at 45.2%, and the five homers he's allowed with the game on the line are no fluke. Wacha's heat map flashes danger zones at .720 on the low-outside corner and a staggering .779 in the lower-middle. Throwing strikes without the ability to miss bats or induce weak contact is a death sentence in today's game, and right now Wacha is turning too many at-bats into damage opportunities. The silver lining? His changeup and curveball remain legitimate weapons—and he'll need to lean on them heavily to reverse this trend. Pitcher Situation PA HR K% BB% Barrel/BBE% HardHit% xSLG xwOBA Noah Cameron Go-Ahead/Tie 70 5 18.6% 8.6% 15.7% 39.2% .552 .394 Michael Wacha Go-Ahead/Tie 80 5 18.8% 3.8% 9.7% 45.2% .540 .370 Seth Lugo Go-Ahead/Tie 65 2 18.5% 7.7% 16.7% 47.9% .618 .400 Lucas Erceg Go-Ahead/Tie 54 0 14.8% 13.0% 0.0% 31.6% .331 .333 Kris Bubic Go-Ahead/Tie 56 2 25.0% 7.1% 10.5% 44.7% .483 .345 Daniel Lynch IV Go-Ahead/Tie 38 2 26.3% 10.5% 12.5% 37.5% .438 .318 Seth Lugo is the most fascinating case study of the bunch. He's allowed only two homers across 65 high-leverage plate appearances, yet his .618 xSLG leads the team, and his HardHit% checks in at 47.9%. Lugo is surviving, make no mistake—but he is absolutely not dominating. His heat map is genuinely concerning: a .921 xwOBA up and away and .571 in the upper-middle. Hitters are squaring him up all over the zone, but Kansas City's elite defense has masked a surprising amount of loud contact. Lugo is navigating treacherous waters, and his expected slugging suggests those loud contact events are going to start finding grass and bleachers sooner rather than later. Lucas Erceg offers the stark contrast. He has allowed zero home runs in 54 high-leverage appearances. His barrel rate sits at an immaculate 0.0%, his HardHit% at 31.6%, and his .331 xSLG is the lowest on the entire staff. His heat map is ice-cold across almost every quadrant. That sinker, with its extreme horizontal run, generates weak grounders on command. Erceg isn't trying to punch anyone out; he's trying to keep the ball inside the yard, and so far, he's executing that mission flawlessly. Daniel Lynch IV: The Name No One Mentions Lynch has surrendered just two homers in 38 high-leverage plate appearances, striking out 26.3% of hitters while posting a .318 xwOBA—the second-lowest mark among the group. His heat map is the coldest of them all. He has a lone hot spot in the upper-middle (1.860 xwOBA), but everything else is deep blue: .265 up and away, .160 low and away, .097 low and in. Lynch leans on his changeup and slider to keep hitters off-balance and guessing. In a season where the pitching staff has been a perpetual headache, Lynch has quietly morphed into a reliable, go-to weapon. The Path Forward Cole Ragans is on the injured list. So is Kris Bubic. Carlos Estévez, who was supposed to anchor the bullpen, has been sidelined since April. Ragans, before his shutdown, was the most intriguing rollercoaster of them all: a dazzling 34.4% strikeout rate in high-leverage spots, undermined by a shaky 12.5% walk rate. His control issues turned every outing into a crapshoot. Bubic's absence (2 HR allowed in 56 PA, .483 xSLG) has left a void that neither Cameron nor Wacha has been able to fill with any consistency. The Royals need their arms to find the command that has so far eluded them when the game hangs in the balance. Erceg and Lynch have proven it's possible. Cameron and Wacha are due for adjustments. Lugo is walking a tightrope, and his heat map suggests the reckoning could be closer than his traditional ERA indicates. But this isn't just a pitching problem. The offense hasn't held up its end of the bargain, either. When the staff has coughed up runs in critical spots, the bats have largely gone silent. Kansas City has scored just 33.9% of its runs via the home run, ranking 26th in the big leagues. Worse, their homers have been overwhelmingly solo affairs—nine of their last ten have come with the bases empty. To win close, low-scoring affairs, you need more than just consistent pitching and defense; you need timely thunder. When Ragans, Bubic, and Estévez eventually return, the front office will have a chance to recalibrate the hierarchy. But the lesson of this season is already crystal clear: the talent is plainly there. What's missing is dependability when the game is hanging in the balance. If this staff can finally find its rhythm in pressure-packed situations—and if the lineup starts connecting with ducks on the pond—those narrow losses will start flipping into gritty wins. For now, though, the Royals are still searching for that elusive consistency. When they find it, one-run games will finally start tilting in their favor. View full article
-
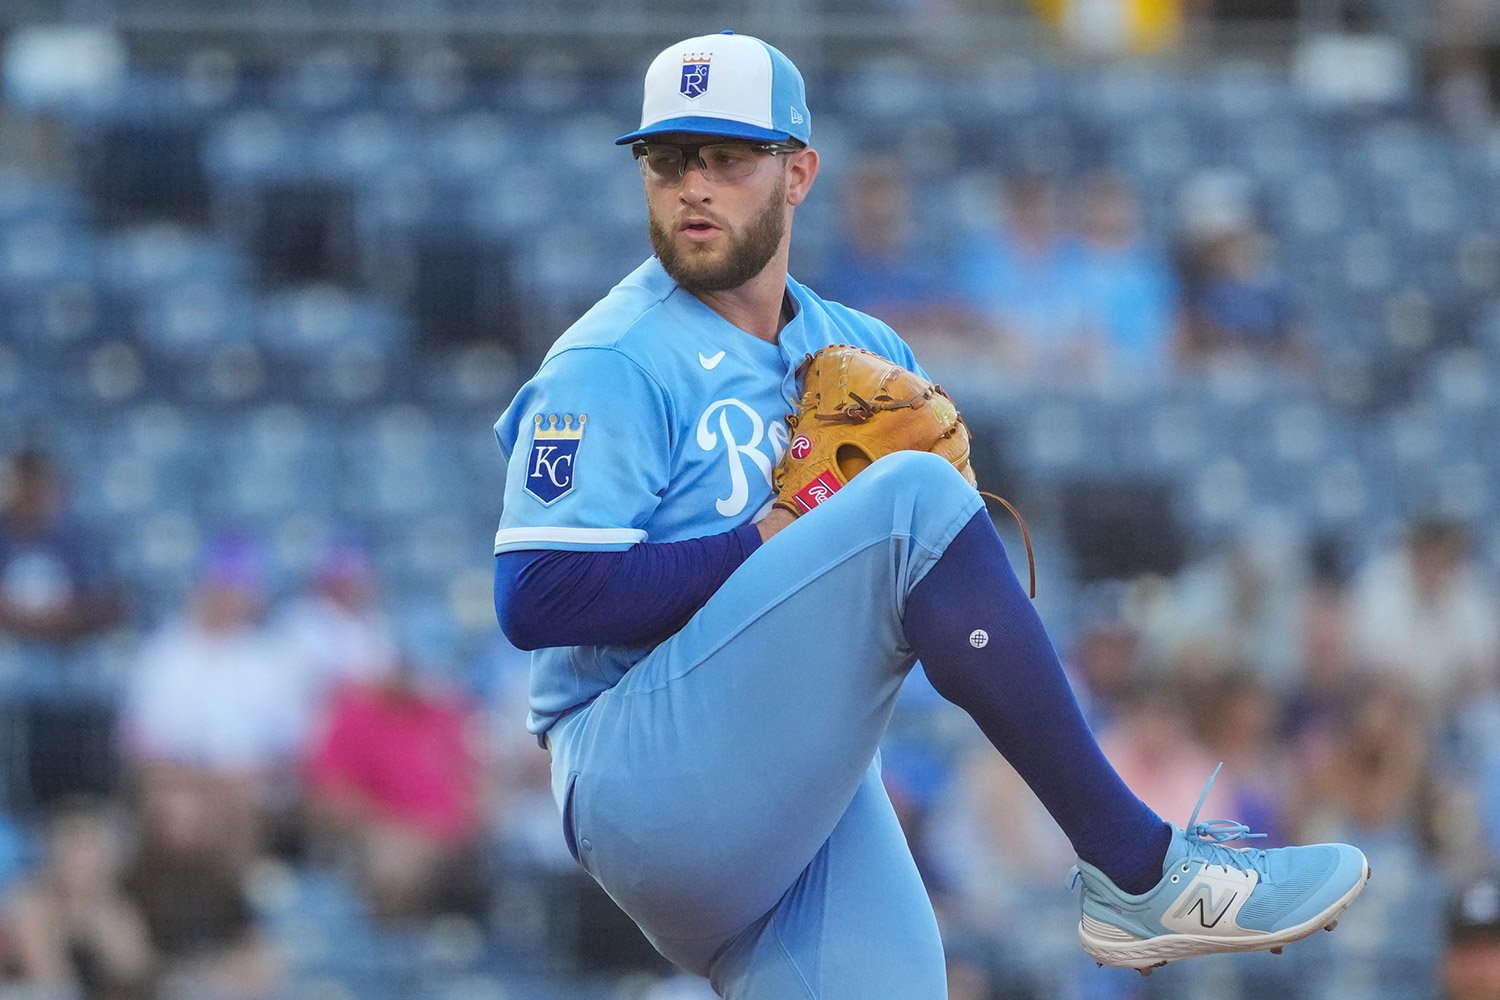 When the tying or go-ahead run is standing on second, the Royals' staff has a knack for falling apart in ways that cold, hard numbers, like the 50 homers they've surrendered with runners on base, the most in the majors, barely begin to capture. They've allowed 46.6% of their total runs via the long ball, the second-highest rate in baseball and well above the league-average mark of 39.8%. They've also given up 13 three-run homers, tied for third-most. The trend followed them to Washington in their last series, where six of the fifteen runs they coughed up came on just two swings; both three-run shots. The Strikeout Trap Noah Cameron has been, on paper, one of the more intriguing arms in the system. His slider generates whiffs, and his 18.6% strikeout rate in pressure-packed plate appearances is nothing to dismiss. But when Cameron misses, he misses in the worst possible locations. Across 70 high-leverage trips to the plate, he's allowed five homers, paired with a 15.7% barrel rate and a .552 expected slugging percentage. His heat map tells the whole story: a .696 xwOBA in the upper-middle third, and .452 on the inner half up. When he elevates his fastball or leaves it drifting into the hitter's wheelhouse, the punishment is immediate. Cameron hasn't lost his stuff—his sweeping slider is still nasty—but his arsenal, and particularly a fastball that lacks true vertical ride, is poorly suited for the high-leverage moments he's being thrown into. Michael Wacha sits on the opposite end of the spectrum. He doesn't beat himself with free passes (3.8% walk rate in high-leverage spots), but his fastball averages just 88.4 mph, and hitters know it's coming. His HardHit% in those same clutch situations sits at 45.2%, and the five homers he's allowed with the game on the line are no fluke. Wacha's heat map flashes danger zones at .720 on the low-outside corner and a staggering .779 in the lower-middle. Throwing strikes without the ability to miss bats or induce weak contact is a death sentence in today's game, and right now Wacha is turning too many at-bats into damage opportunities. The silver lining? His changeup and curveball remain legitimate weapons—and he'll need to lean on them heavily to reverse this trend. Pitcher Situation PA HR K% BB% Barrel/BBE% HardHit% xSLG xwOBA Noah Cameron Go-Ahead/Tie 70 5 18.6% 8.6% 15.7% 39.2% .552 .394 Michael Wacha Go-Ahead/Tie 80 5 18.8% 3.8% 9.7% 45.2% .540 .370 Seth Lugo Go-Ahead/Tie 65 2 18.5% 7.7% 16.7% 47.9% .618 .400 Lucas Erceg Go-Ahead/Tie 54 0 14.8% 13.0% 0.0% 31.6% .331 .333 Kris Bubic Go-Ahead/Tie 56 2 25.0% 7.1% 10.5% 44.7% .483 .345 Daniel Lynch IV Go-Ahead/Tie 38 2 26.3% 10.5% 12.5% 37.5% .438 .318 Seth Lugo is the most fascinating case study of the bunch. He's allowed only two homers across 65 high-leverage plate appearances, yet his .618 xSLG leads the team, and his HardHit% checks in at 47.9%. Lugo is surviving, make no mistake—but he is absolutely not dominating. His heat map is genuinely concerning: a .921 xwOBA up and away and .571 in the upper-middle. Hitters are squaring him up all over the zone, but Kansas City's elite defense has masked a surprising amount of loud contact. Lugo is navigating treacherous waters, and his expected slugging suggests those loud contact events are going to start finding grass and bleachers sooner rather than later. Lucas Erceg offers the stark contrast. He has allowed zero home runs in 54 high-leverage appearances. His barrel rate sits at an immaculate 0.0%, his HardHit% at 31.6%, and his .331 xSLG is the lowest on the entire staff. His heat map is ice-cold across almost every quadrant. That sinker, with its extreme horizontal run, generates weak grounders on command. Erceg isn't trying to punch anyone out; he's trying to keep the ball inside the yard, and so far, he's executing that mission flawlessly. Daniel Lynch IV: The Name No One Mentions Lynch has surrendered just two homers in 38 high-leverage plate appearances, striking out 26.3% of hitters while posting a .318 xwOBA—the second-lowest mark among the group. His heat map is the coldest of them all. He has a lone hot spot in the upper-middle (1.860 xwOBA), but everything else is deep blue: .265 up and away, .160 low and away, .097 low and in. Lynch leans on his changeup and slider to keep hitters off-balance and guessing. In a season where the pitching staff has been a perpetual headache, Lynch has quietly morphed into a reliable, go-to weapon. The Path Forward Cole Ragans is on the injured list. So is Kris Bubic. Carlos Estévez, who was supposed to anchor the bullpen, has been sidelined since April. Ragans, before his shutdown, was the most intriguing rollercoaster of them all: a dazzling 34.4% strikeout rate in high-leverage spots, undermined by a shaky 12.5% walk rate. His control issues turned every outing into a crapshoot. Bubic's absence (2 HR allowed in 56 PA, .483 xSLG) has left a void that neither Cameron nor Wacha has been able to fill with any consistency. The Royals need their arms to find the command that has so far eluded them when the game hangs in the balance. Erceg and Lynch have proven it's possible. Cameron and Wacha are due for adjustments. Lugo is walking a tightrope, and his heat map suggests the reckoning could be closer than his traditional ERA indicates. But this isn't just a pitching problem. The offense hasn't held up its end of the bargain, either. When the staff has coughed up runs in critical spots, the bats have largely gone silent. Kansas City has scored just 33.9% of its runs via the home run, ranking 26th in the big leagues. Worse, their homers have been overwhelmingly solo affairs—nine of their last ten have come with the bases empty. To win close, low-scoring affairs, you need more than just consistent pitching and defense; you need timely thunder. When Ragans, Bubic, and Estévez eventually return, the front office will have a chance to recalibrate the hierarchy. But the lesson of this season is already crystal clear: the talent is plainly there. What's missing is dependability when the game is hanging in the balance. If this staff can finally find its rhythm in pressure-packed situations—and if the lineup starts connecting with ducks on the pond—those narrow losses will start flipping into gritty wins. For now, though, the Royals are still searching for that elusive consistency. When they find it, one-run games will finally start tilting in their favor.
 -
Kevin, I really appreciate that perspective, and I think you're touching on something important that can be easy to overlook when we focus strictly on performance metrics. The organizational value and clubhouse presence that Lynch has built over the years may carry more weight in Kansas City than it would in some other organizations. As you mentioned, the Royals have often shown a willingness to consider those factors as part of the broader evaluation process, and there is certainly something to be said for having a player who understands the culture and has earned the trust of both teammates and coaches. I also agree that the Fermin trade was notable because it reflected a more proactive approach to asset management than we've historically seen from the organization. That's part of what makes Lynch such an intriguing case. There are compelling arguments both for holding onto him and for exploring the market while his value appears to be trending upward. And you're absolutely right about the bullpen. Given how difficult it is to find reliable relief pitching, there's a strong case that his value to the Royals over the final months of the season could exceed what another club is willing to offer. Either way, I suspect we're going to learn quite a bit about the organization's current philosophy from whatever decision they make. Thanks again for the thoughtful discussion. These kinds of exchanges are one of the best parts of covering the game.
-
Kevin, thank you so much for the thoughtful comment. It truly means a lot coming from someone whose work I genuinely enjoy and follow closely. I'm very familiar with your excellent Royals coverage, so I truly appreciate you taking the time to read the article and share your perspective. I'm also very glad that we can exchange ideas and discuss the team together. I also think you raise a completely fair point. What stands out to me is that we're no longer debating whether Lynch can be a productive major-league pitcher. The conversation has shifted to what his value is and how the organization should maximize it, which is a very different place than where he was not long ago. I agree that this may be close to his ceiling in terms of role. I don't see him returning to the rotation, and at least right now, he doesn't seem like the obvious long-term ninth-inning option. But I wonder if that's exactly what could make him attractive to contenders. Teams are always looking for versatile leverage arms who can neutralize left-handed hitters, enter with runners on base, and provide more than three outs when necessary. Lynch is starting to fit that profile, and his background as a starter only adds to that flexibility. The Freddy Fermin comparison is an interesting one because I can absolutely see the logic. If another organization believes these pitch-quality improvements are sustainable, they may value Lynch as more than a middle reliever, and that's where the conversation becomes fascinating from a trade standpoint. At the same time, part of me wonders whether the Royals may view him as one of the success stories of their pitching development group and decide that the value he provides internally outweighs the potential return. Either way, I completely agree with you that his future in Kansas City feels much less certain than his current effectiveness, and that's probably what makes him such an interesting player to watch over the next several weeks. Thanks again for reading and for adding such a thoughtful perspective to the discussion.
-
Image courtesy of © Brad Mills-Imagn Images The easiest way to describe Bobby Witt Jr.’s defense is to call him the best defensive shortstop in baseball. The more accurate way is to say he has become the centerpiece of something much bigger. Over the past several years, the Royals have searched for different ways to build a sustainable contender around Witt. Some of those answers have come on the mound. Others have involved improving an offense that has struggled at times to score consistently. Yet one of the organization’s most significant accomplishments has largely flown under the radar: building a defensive core capable of preventing runs at an elite level. That story begins with Witt, but it does not end with him. Since the start of the 2024 season, no player in Major League Baseball has accumulated more Outs Above Average than Kansas City’s shortstop. His +58 OAA leads all defenders, regardless of position. Player Position OAA Since 2024 Bobby Witt Jr. SS 58 Pete Crow-Armstrong CF 52 Jacob Young CF 44 Andrés Giménez 2B 39 Mauricio Dubón 2B 37 The numbers are impressive on their own, but they only tell part of the story. Great defenses rarely depend on a single player. An exceptional defender can steal a few hits. A complete defensive structure can change the way an entire pitching staff operates. That is exactly what Kansas City has built. More Than One Elite Defender The Royals are one of the few organizations that can claim elite defenders at multiple premium positions at the same time. Since 2024, Witt ranks first among all shortstops. Kyle Isbel has established himself as one of the sport’s top defensive center fielders. Maikel Garcia has emerged as one of the most valuable defensive third basemen in the majors. Michael Massey, meanwhile, has become one of the American League’s steadiest second basemen. Together, they form the backbone of nearly everything Kansas City does defensively. Player Position OAA Since 2024 Positional Rank Bobby Witt Jr. SS 58 1st Kyle Isbel CF 25 T-4th Maikel Garcia 3B 23 2nd Michael Massey 2B 12 T-7th Combined, the group has accumulated +118 Outs Above Average. That total becomes even more impressive when you consider what it represents. It is not simply a measure of speed or athleticism. It reflects range, anticipation, positioning, reads off the bat, and consistency across thousands of defensive opportunities. What makes the group fascinating is that each player arrives at that value in a different way. Witt stands out because of the amount of ground he covers. His first step is exceptional, allowing him to reach balls that are simply out of range for most shortstops. Many of the plays that look routine on a highlight reel are only possible because Witt got to a ball that another defender never would have touched. Isbel brings something different. Center field demands speed, instincts, and the ability to process information quickly. Those are precisely the traits that make Isbel valuable. His routes are efficient, his reactions are quick, and his ability to convert difficult opportunities into outs has placed him among the game’s most effective defenders. Perhaps the most interesting case, however, is Garcia. When people think of elite third-base defense, they often picture diving stops down the line or spectacular throws across the diamond. Garcia is capable of both, but his greatest value shows up elsewhere. Since 2024, he has accumulated +24 Outs Above Average on balls hit in front of him, an extraordinary number even among the position’s elite defenders. His ability to attack slow rollers, anticipate choppers, and charge aggressively has become a genuine competitive advantage. Garcia does not wait for the play to come to him. He attacks it before it has a chance to become a problem. Then there is Massey. Unlike his teammates, he rarely generates headlines. His value comes from stability. Second base demands constant versatility: moving in both directions, turning double plays under pressure, providing support on defensive rotations, and serving as the bridge between shortstop and the corners. Massey has developed a rare ability to do all of those things consistently. He may not make the most spectacular play on the field. What he does is prevent routine plays from becoming problems. A Defense Built to Win Games The Royals have not assembled four standout defenders operating independently. They have built talent across some of the most important positions on the field. Witt anchors the defense at shortstop, Garcia has become one of the game’s premier defensive third basemen, and Massey provides stability at second base. Isbel ranks among the most valuable defensive center fielders in the majors. And the story does not end there. Kansas City has also ranked among MLB’s leaders in outfield assists, with Jac Caglianone and Lane Thomas adding another dimension to a defense that not only reaches difficult balls but also prevents extra bases. That combination has helped the Royals establish a clear identity. While much of modern baseball searches for advantages through offensive firepower, Kansas City has turned run prevention into one of its defining strengths. There are still questions that will shape the franchise’s future. The defense, however, is not one of them. When a team features the best defensive shortstop in baseball and elite talent throughout the rest of its defensive spine, it possesses a foundation few organizations can match. View full article
-
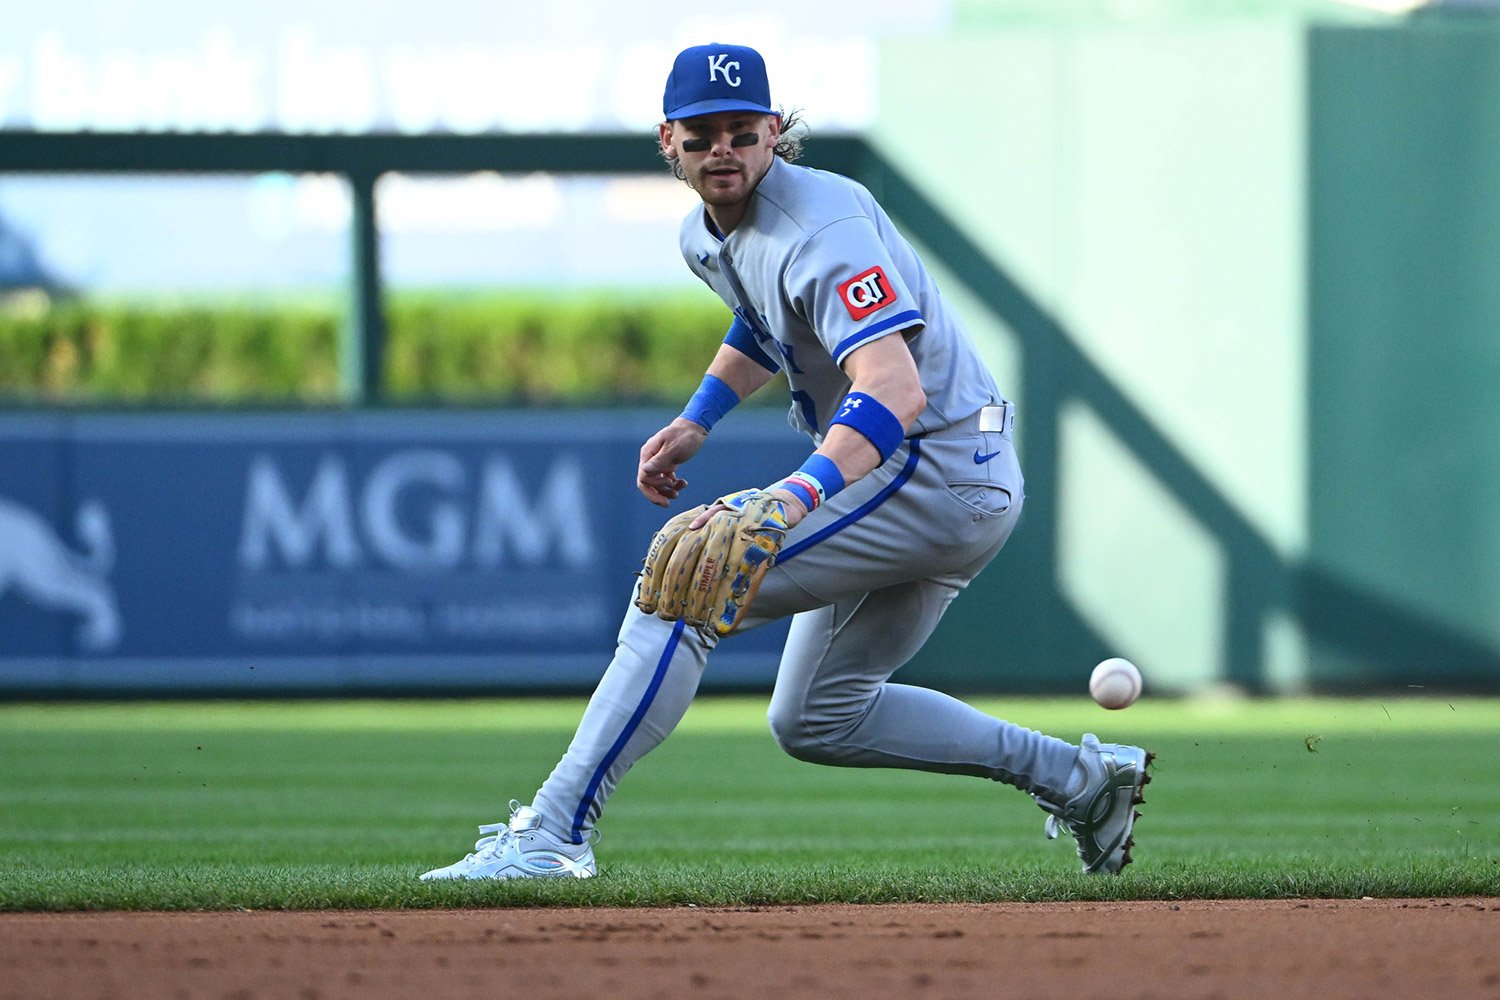 The easiest way to describe Bobby Witt Jr.’s defense is to call him the best defensive shortstop in baseball. The more accurate way is to say he has become the centerpiece of something much bigger. Over the past several years, the Royals have searched for different ways to build a sustainable contender around Witt. Some of those answers have come on the mound. Others have involved improving an offense that has struggled at times to score consistently. Yet one of the organization’s most significant accomplishments has largely flown under the radar: building a defensive core capable of preventing runs at an elite level. That story begins with Witt, but it does not end with him. Since the start of the 2024 season, no player in Major League Baseball has accumulated more Outs Above Average than Kansas City’s shortstop. His +58 OAA leads all defenders, regardless of position. Player Position OAA Since 2024 Bobby Witt Jr. SS 58 Pete Crow-Armstrong CF 52 Jacob Young CF 44 Andrés Giménez 2B 39 Mauricio Dubón 2B 37 The numbers are impressive on their own, but they only tell part of the story. Great defenses rarely depend on a single player. An exceptional defender can steal a few hits. A complete defensive structure can change the way an entire pitching staff operates. That is exactly what Kansas City has built. More Than One Elite Defender The Royals are one of the few organizations that can claim elite defenders at multiple premium positions at the same time. Since 2024, Witt ranks first among all shortstops. Kyle Isbel has established himself as one of the sport’s top defensive center fielders. Maikel Garcia has emerged as one of the most valuable defensive third basemen in the majors. Michael Massey, meanwhile, has become one of the American League’s steadiest second basemen. Together, they form the backbone of nearly everything Kansas City does defensively. Player Position OAA Since 2024 Positional Rank Bobby Witt Jr. SS 58 1st Kyle Isbel CF 25 T-4th Maikel Garcia 3B 23 2nd Michael Massey 2B 12 T-7th Combined, the group has accumulated +118 Outs Above Average. That total becomes even more impressive when you consider what it represents. It is not simply a measure of speed or athleticism. It reflects range, anticipation, positioning, reads off the bat, and consistency across thousands of defensive opportunities. What makes the group fascinating is that each player arrives at that value in a different way. Witt stands out because of the amount of ground he covers. His first step is exceptional, allowing him to reach balls that are simply out of range for most shortstops. Many of the plays that look routine on a highlight reel are only possible because Witt got to a ball that another defender never would have touched. Isbel brings something different. Center field demands speed, instincts, and the ability to process information quickly. Those are precisely the traits that make Isbel valuable. His routes are efficient, his reactions are quick, and his ability to convert difficult opportunities into outs has placed him among the game’s most effective defenders. Perhaps the most interesting case, however, is Garcia. When people think of elite third-base defense, they often picture diving stops down the line or spectacular throws across the diamond. Garcia is capable of both, but his greatest value shows up elsewhere. Since 2024, he has accumulated +24 Outs Above Average on balls hit in front of him, an extraordinary number even among the position’s elite defenders. His ability to attack slow rollers, anticipate choppers, and charge aggressively has become a genuine competitive advantage. Garcia does not wait for the play to come to him. He attacks it before it has a chance to become a problem. Then there is Massey. Unlike his teammates, he rarely generates headlines. His value comes from stability. Second base demands constant versatility: moving in both directions, turning double plays under pressure, providing support on defensive rotations, and serving as the bridge between shortstop and the corners. Massey has developed a rare ability to do all of those things consistently. He may not make the most spectacular play on the field. What he does is prevent routine plays from becoming problems. A Defense Built to Win Games The Royals have not assembled four standout defenders operating independently. They have built talent across some of the most important positions on the field. Witt anchors the defense at shortstop, Garcia has become one of the game’s premier defensive third basemen, and Massey provides stability at second base. Isbel ranks among the most valuable defensive center fielders in the majors. And the story does not end there. Kansas City has also ranked among MLB’s leaders in outfield assists, with Jac Caglianone and Lane Thomas adding another dimension to a defense that not only reaches difficult balls but also prevents extra bases. That combination has helped the Royals establish a clear identity. While much of modern baseball searches for advantages through offensive firepower, Kansas City has turned run prevention into one of its defining strengths. There are still questions that will shape the franchise’s future. The defense, however, is not one of them. When a team features the best defensive shortstop in baseball and elite talent throughout the rest of its defensive spine, it possesses a foundation few organizations can match.
 -
Image courtesy of © Andrew Dieb-Imagn Images Few players spend as much time caught between promise and production as Daniel Lynch IV did. The talent was always evident. Establishing himself in the role the Royals envisioned for him proved far more difficult. The Royals invested in him, hoping he would become an important piece of their rotation. There were flashes. There were promising starts. There were also injuries, inconsistencies, and seasons in which the results never quite reflected the potential that once made him one of the organization’s top prospects. In 2026, however, the story is different. Not because Lynch has finally become the starter many envisioned years ago. The transformation has come in another form. After making a permanent move to the bullpen, the left-hander appears to have found the identity he spent years searching for. The results are difficult to ignore. Through his first 30 appearances of the season, Lynch owns a 1.80 ERA, has allowed just 18 hits across 30 innings, and is holding opposing hitters to a .170 batting average. More importantly, the indicators behind those numbers suggest this is something deeper than a simple hot streak. The evolution begins with the quality of his pitches. table { border-collapse: collapse; font-family: Arial, sans-serif; font-size: 28px; width: 100%; } th { background-color: #4472a8; color: #ffffff; text-align: left; padding: 10px 14px; border: 1px solid #ffffff; } td { padding: 10px 14px; border: 1px solid #d0d0d0; color: #000000; } .stuff-2025 { background-color: #6c93c9; } .loc-2025 { background-color: #eef2f8; } .pitch-2025 { background-color: #eef2f8; } .stuff-2026 { background-color: #f4948c; } .loc-2026 { background-color: #fbf0ef; } .pitch-2026 { background-color: #f06b62; } Season Stuff+ Location+ Pitching+ 2025 95 99 97 2026 107 100 109 The table highlights one of the most significant changes in Lynch’s season. For much of his major-league career, the left-hander relied on command to compensate for an arsenal that rarely graded above average. In 2026, that equation has flipped. His command remains largely unchanged, but the quality of his pitches has taken the biggest step forward of his career. The development of his sinker, slider, and changeup has completely altered the way hitters interact with his repertoire. And that’s where the story becomes particularly interesting. The improvement is not limited to traditional metrics. It is also visible in the quality of swings he is generating. table { border-collapse: collapse; font-family: Arial, sans-serif; font-size: 28px; width: 100%; } th { background-color: #4472a8; color: #ffffff; text-align: left; padding: 10px 14px; border: 1px solid #ffffff; } td { padding: 10px 14px; border: 1px solid #d0d0d0; color: #000000; } .oswing-2025 { background-color: #fbeceb; } .contact-2025 { background-color: #6c93c9; } .swstr-2025 { background-color: #e8554d; } .oswing-2026 { background-color: #f4f0f5; } .contact-2026 { background-color: #7fa0cf; } .swstr-2026 { background-color: #f4948c; } Season O-Swing% Contact% SwStr% 2025 25.8% 79.4% 8.6% 2026 31.6% 69.0% 14.3% Opponents are chasing pitches outside the strike zone more often than ever before. At the same time, they are making significantly less contact when they decide to swing. That combination is often one of the clearest signs that a pitcher has genuinely improved the quality of his arsenal. For Lynch, the slider appears to be playing a central role. After several seasons of inconsistent results, the pitch has regained its ability to generate whiffs, producing a whiff rate north of 45% in 2026. His changeup continues to deliver strong results as well, while his 94.4 mph sinker allows him to generate uncomfortable contact even when he does not record a strikeout. Bat Tracking data helps visualize that evolution. It shows not only more swing-and-miss against several of his pitches, but also a significant reduction in ideal contact. In other words, when hitters are not missing, they are not striking the ball with the authority they once did. That distinction is important because it helps explain one of the most intriguing aspects of his season. Lynch has recorded 29 strikeouts in 30 innings, a strong figure for any reliever. Yet his success does not depend exclusively on swing-and-miss. In fact, he entered mid-June having gone five consecutive appearances without recording a strikeout. For most modern relievers, that would raise concerns. For Lynch, it simply demonstrates that there is more than one path to success. His ability to limit damage when the ball is put in play has been nearly as valuable as his ability to generate whiffs. Left-handed hitters, for example, are batting just .118 against him in 51 at-bats, the lowest mark in the American League among pitchers who have faced at least 50 left-handed batters this season. That ability to neutralize specific matchups has dramatically increased his value within the bullpen. The same can be said for his work in high-leverage situations with runners on base. Lynch has inherited 14 runners this season, and only two have come around to score. The Royals are not simply using the left-hander to absorb low-risk innings. They are using him to put out fires. That detail helps explain why his impact extends far beyond ERA. The most valuable relievers often share a common trait: the trust of the coaching staff. They are the pitchers called upon when the game is still hanging in the balance, when a runner on second can be the difference between a win and a loss, and when the opposing team’s best hitters are about to step to the plate. Lynch has earned that level of responsibility. Perhaps the most remarkable part of this evolution is that it comes after years in which his future appeared uncertain. Many pitchers spend much of their careers trying to become successful starters. Some never get there. A much smaller group discovers that their best version was waiting somewhere else all along. Everything points to Lynch belonging to that second category. The 1.80 ERA is unlikely to last forever. Few relievers sustain numbers that extreme over a full season. The changes driving those results, however, appear far more sustainable than the ERA itself. Hitters are chasing more pitches outside the zone. They are making less contact. They are producing weaker contact. And Lynch is accomplishing all of that with the best arsenal he has shown since reaching the major leagues. For years, Kansas City waited for Daniel Lynch IV to find his place within the organization. The answer turned out to be much simpler than anyone expected. It wasn’t in the rotation. It was in the bullpen. View full article
-
Daniel Lynch IV Finally Found His Place In Kansas City
Yirsandy Rodríguez posted an article in Royals
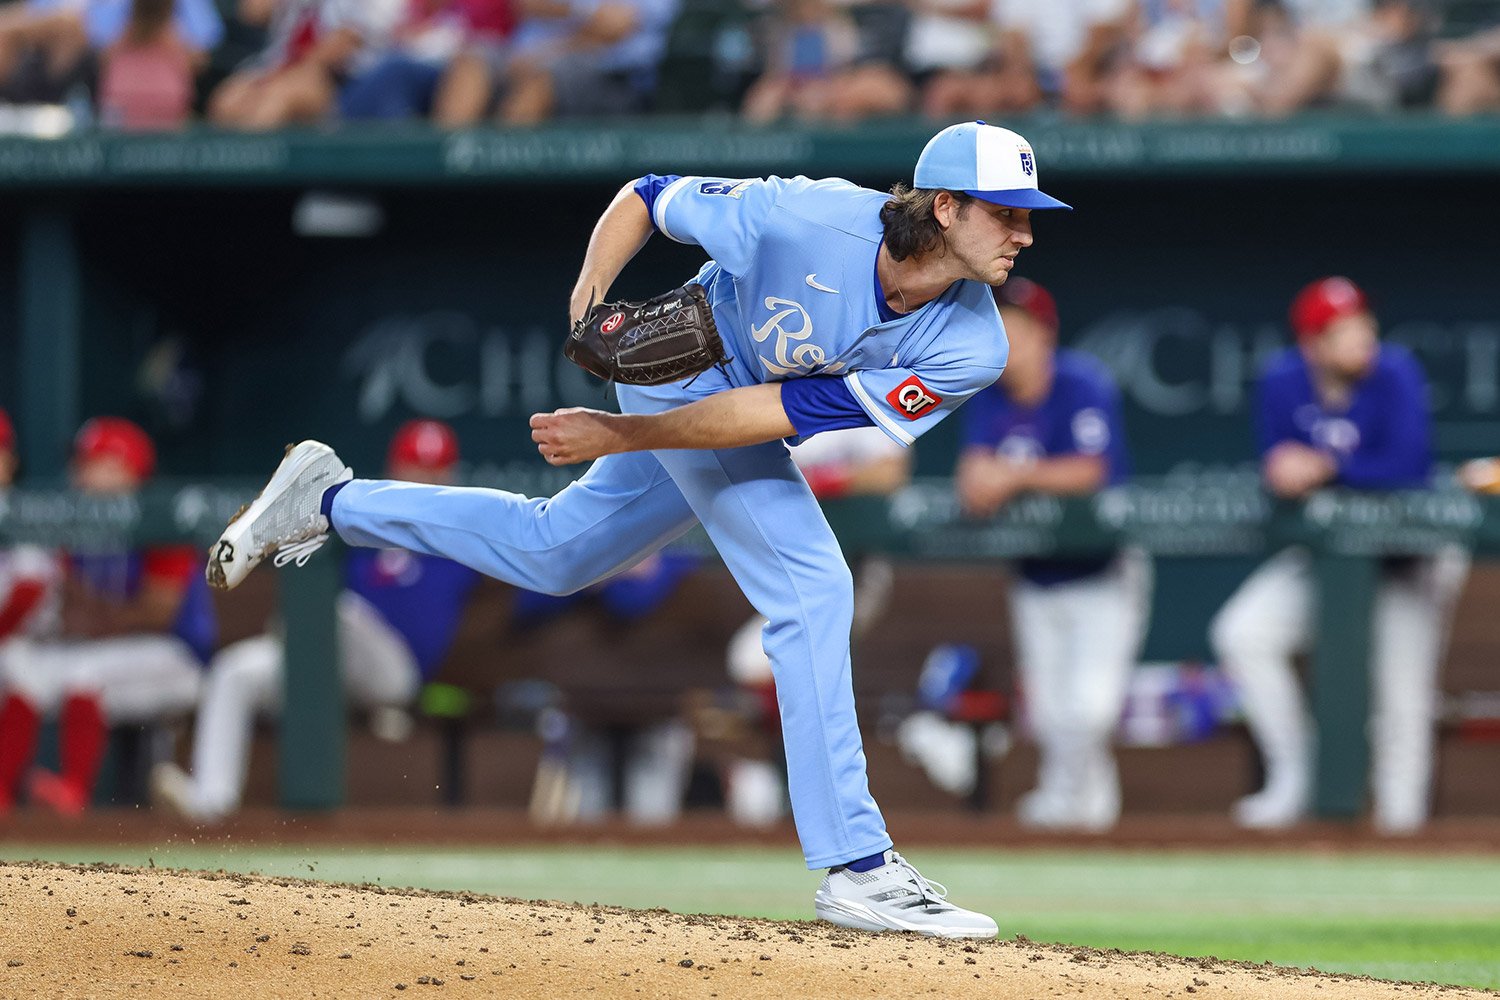 Few players spend as much time caught between promise and production as Daniel Lynch IV did. The talent was always evident. Establishing himself in the role the Royals envisioned for him proved far more difficult. The Royals invested in him, hoping he would become an important piece of their rotation. There were flashes. There were promising starts. There were also injuries, inconsistencies, and seasons in which the results never quite reflected the potential that once made him one of the organization’s top prospects. In 2026, however, the story is different. Not because Lynch has finally become the starter many envisioned years ago. The transformation has come in another form. After making a permanent move to the bullpen, the left-hander appears to have found the identity he spent years searching for. The results are difficult to ignore. Through his first 30 appearances of the season, Lynch owns a 1.80 ERA, has allowed just 18 hits across 30 innings, and is holding opposing hitters to a .170 batting average. More importantly, the indicators behind those numbers suggest this is something deeper than a simple hot streak. The evolution begins with the quality of his pitches. table { border-collapse: collapse; font-family: Arial, sans-serif; font-size: 28px; width: 100%; } th { background-color: #4472a8; color: #ffffff; text-align: left; padding: 10px 14px; border: 1px solid #ffffff; } td { padding: 10px 14px; border: 1px solid #d0d0d0; color: #000000; } .stuff-2025 { background-color: #6c93c9; } .loc-2025 { background-color: #eef2f8; } .pitch-2025 { background-color: #eef2f8; } .stuff-2026 { background-color: #f4948c; } .loc-2026 { background-color: #fbf0ef; } .pitch-2026 { background-color: #f06b62; } Season Stuff+ Location+ Pitching+ 2025 95 99 97 2026 107 100 109 The table highlights one of the most significant changes in Lynch’s season. For much of his major-league career, the left-hander relied on command to compensate for an arsenal that rarely graded above average. In 2026, that equation has flipped. His command remains largely unchanged, but the quality of his pitches has taken the biggest step forward of his career. The development of his sinker, slider, and changeup has completely altered the way hitters interact with his repertoire. And that’s where the story becomes particularly interesting. The improvement is not limited to traditional metrics. It is also visible in the quality of swings he is generating. table { border-collapse: collapse; font-family: Arial, sans-serif; font-size: 28px; width: 100%; } th { background-color: #4472a8; color: #ffffff; text-align: left; padding: 10px 14px; border: 1px solid #ffffff; } td { padding: 10px 14px; border: 1px solid #d0d0d0; color: #000000; } .oswing-2025 { background-color: #fbeceb; } .contact-2025 { background-color: #6c93c9; } .swstr-2025 { background-color: #e8554d; } .oswing-2026 { background-color: #f4f0f5; } .contact-2026 { background-color: #7fa0cf; } .swstr-2026 { background-color: #f4948c; } Season O-Swing% Contact% SwStr% 2025 25.8% 79.4% 8.6% 2026 31.6% 69.0% 14.3% Opponents are chasing pitches outside the strike zone more often than ever before. At the same time, they are making significantly less contact when they decide to swing. That combination is often one of the clearest signs that a pitcher has genuinely improved the quality of his arsenal. For Lynch, the slider appears to be playing a central role. After several seasons of inconsistent results, the pitch has regained its ability to generate whiffs, producing a whiff rate north of 45% in 2026. His changeup continues to deliver strong results as well, while his 94.4 mph sinker allows him to generate uncomfortable contact even when he does not record a strikeout. Bat Tracking data helps visualize that evolution. It shows not only more swing-and-miss against several of his pitches, but also a significant reduction in ideal contact. In other words, when hitters are not missing, they are not striking the ball with the authority they once did. That distinction is important because it helps explain one of the most intriguing aspects of his season. Lynch has recorded 29 strikeouts in 30 innings, a strong figure for any reliever. Yet his success does not depend exclusively on swing-and-miss. In fact, he entered mid-June having gone five consecutive appearances without recording a strikeout. For most modern relievers, that would raise concerns. For Lynch, it simply demonstrates that there is more than one path to success. His ability to limit damage when the ball is put in play has been nearly as valuable as his ability to generate whiffs. Left-handed hitters, for example, are batting just .118 against him in 51 at-bats, the lowest mark in the American League among pitchers who have faced at least 50 left-handed batters this season. That ability to neutralize specific matchups has dramatically increased his value within the bullpen. The same can be said for his work in high-leverage situations with runners on base. Lynch has inherited 14 runners this season, and only two have come around to score. The Royals are not simply using the left-hander to absorb low-risk innings. They are using him to put out fires. That detail helps explain why his impact extends far beyond ERA. The most valuable relievers often share a common trait: the trust of the coaching staff. They are the pitchers called upon when the game is still hanging in the balance, when a runner on second can be the difference between a win and a loss, and when the opposing team’s best hitters are about to step to the plate. Lynch has earned that level of responsibility. Perhaps the most remarkable part of this evolution is that it comes after years in which his future appeared uncertain. Many pitchers spend much of their careers trying to become successful starters. Some never get there. A much smaller group discovers that their best version was waiting somewhere else all along. Everything points to Lynch belonging to that second category. The 1.80 ERA is unlikely to last forever. Few relievers sustain numbers that extreme over a full season. The changes driving those results, however, appear far more sustainable than the ERA itself. Hitters are chasing more pitches outside the zone. They are making less contact. They are producing weaker contact. And Lynch is accomplishing all of that with the best arsenal he has shown since reaching the major leagues. For years, Kansas City waited for Daniel Lynch IV to find his place within the organization. The answer turned out to be much simpler than anyone expected. It wasn’t in the rotation. It was in the bullpen.
 -
Image courtesy of © Andrew Dieb-Imagn Images Throughout the 2025 and 2026 seasons, the Royals have ranked among the least productive offenses against left-handed pitching. What stands out is not merely the outcome, but how they arrived there. Unlike many teams that populate the bottom of these leaderboards, Kansas City's struggles are not driven by excessive strikeout rates. This is not a lineup incapable of putting the ball in play. The issue has been more nuanced: a combination of insufficient offensive production, a lack of consistent power, and key hitters failing to perform. Team vs LHP (2025-26) AVG xBA OBP xOBP SLG xSLG ISO K% Royals .237 .242 .308 .314 .362 .387 .124 20.70% MLB Average .242 .240 .310 .313 .392 .396 .150 22.60% The Royals have been slightly below the MLB average in both batting average and on-base percentage, but the real gap emerges in slugging and power production. Their .124 ISO ranks among the lowest marks in baseball, while their .362 slugging percentage also sits well below league average. Expected metrics add another important layer to the discussion. Kansas City has not produced contact as poor as the traditional results suggest. Their xbA, xOBP, and xSLG have all been slightly better than their actual numbers, indicating that some degree of poor fortune has influenced the results. The gap, however, is not large enough to alter the broader conclusion. Even if performance had matched the expected metrics exactly, the Royals would still project as a below-average offense against left-handed pitching. The root of the problem becomes apparent when examining who has actually carried the offense. Player PA vs LHP wRC+ 2025 wRC+ 2026 Bobby Witt Jr. 209 135 141 Maikel Garcia 187 155 181 Vinnie Pasquantino 240 63 9 While much of the lineup has oscillated between productive and disappointing seasons, Witt and Garcia have been the only true constants. Witt has posted a wRC+ above 135 in both campaigns, combining plate discipline, quality contact, and enough power to punish mistakes. His production against left-handers is that of an established star. Garcia has been every bit as impressive. After recording a 155 wRC+ against left-handed pitching in 2025, he has elevated that figure to 181 in 2026. His blend of contact ability, plate discipline, and extra-base production has allowed him to become one of the organization’s most effective hitters against southpaws. The problem is that the story largely ends there. If Witt and Garcia represent stability, Pasquantino represents perhaps the most concerning challenge facing the lineup moving forward. He produced a 63 wRC+ against left-handed pitching in 2025. Rather than showing signs of improvement, his production has collapsed to an astonishingly low 9 wRC+ in 2026. Player PA vs LHP AVG OBP SLG wRC+ Vinnie Pasquantino (2025) 164 .212 .250 .364 63 Vinnie Pasquantino (2026) 76 .143 .211 .186 9 The decline is particularly troubling because Pasquantino is not a complementary piece within the offensive structure. He is one of the hitters Kansas City expects to build around. When a player with that profile performs significantly below league average against left-handed pitching for two consecutive seasons, the lineup’s margin for error shrinks considerably. Pitch-type data helps explain part of the struggle. Over the last two seasons, Pasquantino has repeatedly struggled against left-handed sliders, while even his results against fastballs have been inconsistent. His production with runners in scoring position has also offered little indication that a breakthrough is imminent. The Royals’ inconsistency, however, extends well beyond Pasquantino. Salvador Perez provides a different version of the same problem. After posting just a 45 wRC+ against left-handed pitching in 2025, the veteran catcher has rebounded significantly in 2026, raising that figure to 119. The improvement has given the lineup an additional source of offense that was largely absent the previous year, but it also highlights the lack of stability that has defined this group. While Witt and Garcia have maintained high levels of production across both seasons, several of the roster’s most important hitters have swung from one extreme to the other from year to year. Jonathan India offers another example. He produced a near-average 91 wRC+ against lefties in 2025 before slipping to 68 in 2026. Kyle Isbel has gone from a 56 wRC+ to a startling -4. Isaac Collins owns just a 30 wRC+ against left-handed pitching in 2026. Even some of the more encouraging recent contributions from Nick Loftin and Lane Thomas have come in relatively small samples. The result is a lineup that rarely stacks enough legitimate threats together when facing quality left-handed starters. That lack of depth becomes even more apparent in the game’s highest-leverage situations. Royals vs LHP with RISP (2025-26) AVG OBP SLG HR% K% Royals .247 .327 .367 1.8 17.5% MLB Average .249 .330 .394 2.5 21.6% At first glance, the Royals appear competitive in both batting average and strikeout rate. Yet once again, the same pattern emerges: a lack of impact. Their slugging percentage sits well below the league average, while their home-run rate ranks as the fourth-lowest in baseball during the period examined. Production with runners in scoring position has not been distributed evenly either. Witt, Garcia, and a handful of timely contributions from Loftin have generated positive results, but much of the rest of the lineup has struggled to convert opportunities into meaningful damage. That is why Kansas City's struggles against left-handed pitching cannot be explained by a single statistic or one underperforming player. The organization has two hitters who have consistently demonstrated the ability to thrive in these matchups. It has also received occasional contributions from other members of the roster. What it has not found is a sufficiently broad offensive foundation capable of supporting those strengths. As long as Witt and Garcia remain the only truly reliable pillars against left-handed pitching, Kansas City will continue to rely on too many things breaking right at the same time. Over the last two seasons, that has proven to be a formula that rarely works. View full article
-
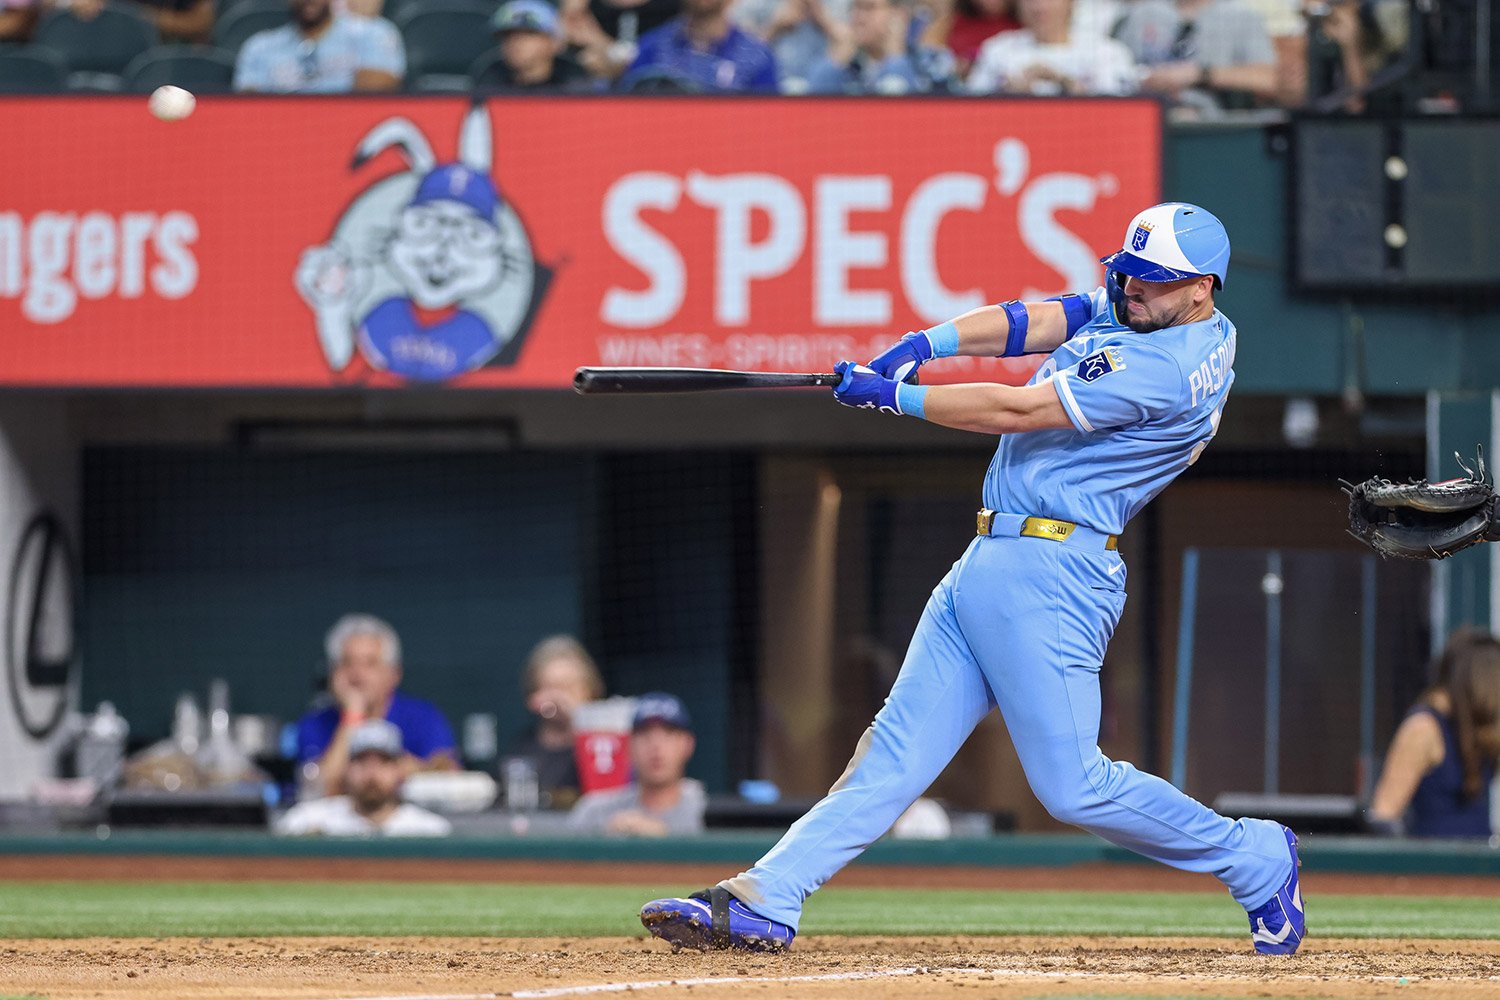 Throughout the 2025 and 2026 seasons, the Royals have ranked among the least productive offenses against left-handed pitching. What stands out is not merely the outcome, but how they arrived there. Unlike many teams that populate the bottom of these leaderboards, Kansas City's struggles are not driven by excessive strikeout rates. This is not a lineup incapable of putting the ball in play. The issue has been more nuanced: a combination of insufficient offensive production, a lack of consistent power, and key hitters failing to perform. Team vs LHP (2025-26) AVG xBA OBP xOBP SLG xSLG ISO K% Royals .237 .242 .308 .314 .362 .387 .124 20.70% MLB Average .242 .240 .310 .313 .392 .396 .150 22.60% The Royals have been slightly below the MLB average in both batting average and on-base percentage, but the real gap emerges in slugging and power production. Their .124 ISO ranks among the lowest marks in baseball, while their .362 slugging percentage also sits well below league average. Expected metrics add another important layer to the discussion. Kansas City has not produced contact as poor as the traditional results suggest. Their xbA, xOBP, and xSLG have all been slightly better than their actual numbers, indicating that some degree of poor fortune has influenced the results. The gap, however, is not large enough to alter the broader conclusion. Even if performance had matched the expected metrics exactly, the Royals would still project as a below-average offense against left-handed pitching. The root of the problem becomes apparent when examining who has actually carried the offense. Player PA vs LHP wRC+ 2025 wRC+ 2026 Bobby Witt Jr. 209 135 141 Maikel Garcia 187 155 181 Vinnie Pasquantino 240 63 9 While much of the lineup has oscillated between productive and disappointing seasons, Witt and Garcia have been the only true constants. Witt has posted a wRC+ above 135 in both campaigns, combining plate discipline, quality contact, and enough power to punish mistakes. His production against left-handers is that of an established star. Garcia has been every bit as impressive. After recording a 155 wRC+ against left-handed pitching in 2025, he has elevated that figure to 181 in 2026. His blend of contact ability, plate discipline, and extra-base production has allowed him to become one of the organization’s most effective hitters against southpaws. The problem is that the story largely ends there. If Witt and Garcia represent stability, Pasquantino represents perhaps the most concerning challenge facing the lineup moving forward. He produced a 63 wRC+ against left-handed pitching in 2025. Rather than showing signs of improvement, his production has collapsed to an astonishingly low 9 wRC+ in 2026. Player PA vs LHP AVG OBP SLG wRC+ Vinnie Pasquantino (2025) 164 .212 .250 .364 63 Vinnie Pasquantino (2026) 76 .143 .211 .186 9 The decline is particularly troubling because Pasquantino is not a complementary piece within the offensive structure. He is one of the hitters Kansas City expects to build around. When a player with that profile performs significantly below league average against left-handed pitching for two consecutive seasons, the lineup’s margin for error shrinks considerably. Pitch-type data helps explain part of the struggle. Over the last two seasons, Pasquantino has repeatedly struggled against left-handed sliders, while even his results against fastballs have been inconsistent. His production with runners in scoring position has also offered little indication that a breakthrough is imminent. The Royals’ inconsistency, however, extends well beyond Pasquantino. Salvador Perez provides a different version of the same problem. After posting just a 45 wRC+ against left-handed pitching in 2025, the veteran catcher has rebounded significantly in 2026, raising that figure to 119. The improvement has given the lineup an additional source of offense that was largely absent the previous year, but it also highlights the lack of stability that has defined this group. While Witt and Garcia have maintained high levels of production across both seasons, several of the roster’s most important hitters have swung from one extreme to the other from year to year. Jonathan India offers another example. He produced a near-average 91 wRC+ against lefties in 2025 before slipping to 68 in 2026. Kyle Isbel has gone from a 56 wRC+ to a startling -4. Isaac Collins owns just a 30 wRC+ against left-handed pitching in 2026. Even some of the more encouraging recent contributions from Nick Loftin and Lane Thomas have come in relatively small samples. The result is a lineup that rarely stacks enough legitimate threats together when facing quality left-handed starters. That lack of depth becomes even more apparent in the game’s highest-leverage situations. Royals vs LHP with RISP (2025-26) AVG OBP SLG HR% K% Royals .247 .327 .367 1.8 17.5% MLB Average .249 .330 .394 2.5 21.6% At first glance, the Royals appear competitive in both batting average and strikeout rate. Yet once again, the same pattern emerges: a lack of impact. Their slugging percentage sits well below the league average, while their home-run rate ranks as the fourth-lowest in baseball during the period examined. Production with runners in scoring position has not been distributed evenly either. Witt, Garcia, and a handful of timely contributions from Loftin have generated positive results, but much of the rest of the lineup has struggled to convert opportunities into meaningful damage. That is why Kansas City's struggles against left-handed pitching cannot be explained by a single statistic or one underperforming player. The organization has two hitters who have consistently demonstrated the ability to thrive in these matchups. It has also received occasional contributions from other members of the roster. What it has not found is a sufficiently broad offensive foundation capable of supporting those strengths. As long as Witt and Garcia remain the only truly reliable pillars against left-handed pitching, Kansas City will continue to rely on too many things breaking right at the same time. Over the last two seasons, that has proven to be a formula that rarely works.
 -
Image courtesy of © Jay Biggerstaff-Imagn Images For much of the season, Isaac Collins' performance has raised a difficult question. How can a hitter who continues to control the strike zone, posts solid quality contact metrics, and owns some of the strongest plate-discipline indicators of his career produce so little offensively? The answer does not appear to be a loss of talent or physical decline. Nor does it stem from the disappearance of the skills that fueled his breakout campaign with Milwaukee in 2025. Instead, the numbers point to something more subtle. Collins is still doing many things well, but a combination of passivity in the strike zone, increased swing-and-miss issues in key situations, and a less efficient contact profile has eroded his offensive value. The disappointment is understandable. Kansas City acquired a player coming off a .263/.368/.411 season that was good for a 122 wRC+ and 2.6 WAR, a performance that established him as one of the Brewers’ most unexpected success stories. Since arriving in Kansas City, however, his production has fallen sharply, turning him into a clearly below-average offensive player. Season PA AVG OBP SLG wRC+ WAR 2025 (MIL) 441 .263 .368 .411 122 2.6 2026 (KC) 217 .212 .335 .302 84 -0.4 At first glance, that decline seems to support the idea that Collins has simply regressed after a season that exceeded his true talent level. A closer look at the underlying metrics, however, tells a more complicated story. His walk rate has actually improved from 12.9% to 13.8%. His barrel rate has climbed from 4.9% to 7.9%. Hard-hit rate has remained virtually unchanged, slipping only from 38.9% to 37.8%, while his average exit velocity has held steady. Even his expected metrics paint a far less severe picture than the one reflected in his traditional slash line. In other words, Collins does not look like a hitter who has suddenly lost the ability to impact the baseball. Several of the indicators that tend to predict future success remain relatively encouraging. The problem is that those strengths are being undermined by changes in the way he is constructing his plate appearances. During his breakout season in Milwaukee, Collins found a valuable balance. His discipline allowed him to avoid chasing pitches outside the zone, but he was also aggressive enough to attack strikes he could handle. That combination helped him work favorable counts and produce quality contact. The 2026 version looks different. His chase rate has barely changed, a strong indication that his plate discipline remains intact. The difference lies within the strike zone itself. Collins is swinging at fewer strikes than he did a year ago and, more importantly, he is allowing significantly more pitches in the heart of the zone to pass without a swing. Metric 2025 2026 Z-Swing% 64.4% 58.3% Heart Swing% 76.1% 65.8% Called Strike% 17.4% 19.6% CSW% 26.4% 28.6% Strikeout Rate 21.1% 25.8% The significance of those numbers extends well beyond a simple discussion about aggressiveness. Collins is not struggling because he is chasing more bad pitches. He is struggling because he is allowing too many good pitches to go by. Every hittable strike he takes increases the likelihood of falling behind in the count. Once the pitcher gains the advantage, the entire dynamic of the plate appearance changes. More breaking balls appear, more offspeed pitches enter the mix, and the hitter is forced into a reactive approach rather than an attacking one. That sequence helps explain another trend that repeatedly shows up in his numbers. While Collins continues to make respectable contact against fastballs, his swing-and-miss rates against breaking and offspeed pitches have become increasingly concerning. When he falls behind in the count, opposing pitchers gain more opportunities to exploit those vulnerabilities, and the rise in his strikeout rate is the natural consequence. The damage, however, does not stop there. Once the ball is put in play, Collins’ contact profile looks dramatically different from the one that fueled his success in Milwaukee. If there is a single statistic that best captures the difference between the two versions of Collins, it is probably the distribution of his batted balls. Season Line Drive% Ground Ball% Fly Ball% BABIP 2025 24.6% 41.1% 34.3% .326 2026 16.8% 32.8% 50.4% .287 A decline of nearly eight percentage points in line-drive rate represents a major red flag. For a hitter with Collins’ profile, line drives are the foundation of offensive success. His value has never been built around elite power. At his best, he generated hard contact on productive trajectories, producing hits consistently while maximizing his ability to reach base. That profile has largely disappeared. His fly-ball rate has jumped by more than sixteen percentage points compared to last season, while his line-drive rate has collapsed. The consequences have been immediate: fewer hits, fewer extra-base hits, and a substantial drop in BABIP. What makes the situation particularly interesting is that it helps reconcile two seemingly contradictory realities. On one hand, Collins continues to post respectable contact metrics. On the other hand, his production keeps declining. Both can be true at the same time. A hitter can still produce some loud contact and yet have a disappointing season if those opportunities become less frequent or if an increasing share of his batted balls turns into relatively harmless fly balls. That description fits Collins’ first few months in Kansas City remarkably well. Another factor that has deepened the decline has been his performance against left-handed pitching. Split AVG OBP SLG wRC+ vs. RHP .233 .382 .325 107 vs. LHP .169 .222 .254 30 While he remains reasonably productive against right-handers thanks to his ability to get on base, he has been one of the least effective hitters in baseball against left-handed pitching. The gap is so dramatic that it has significantly reduced his margin for error and limited his overall impact as a switch-hitter in the lineup. Even so, the most important conclusion is not that Collins has become a bad player. He continues to draw walks at an excellent rate, maintains contact-quality metrics that closely resemble last season’s numbers, and still possesses many of the skills that fueled his breakout in Milwaukee. What has changed is not the quality of those tools, but the way he is using them. In 2025, Collins forced pitchers to react to him. This season, far too often, the opposite has been true. By allowing more hittable strikes to pass, he has put himself in disadvantageous counts where breaking balls, swing-and-miss issues, and less productive contact begin to dictate the outcome of the plate appearance. That is why the solution likely does not require a complete overhaul or a dramatic mechanical adjustment. The Royals do not need a different player. They need the version of Collins that attacked hittable strikes and turned selective aggression into offensive production. Until that version returns, Kansas City will continue waiting for the hitter it believed it acquired over the winter. View full article
-
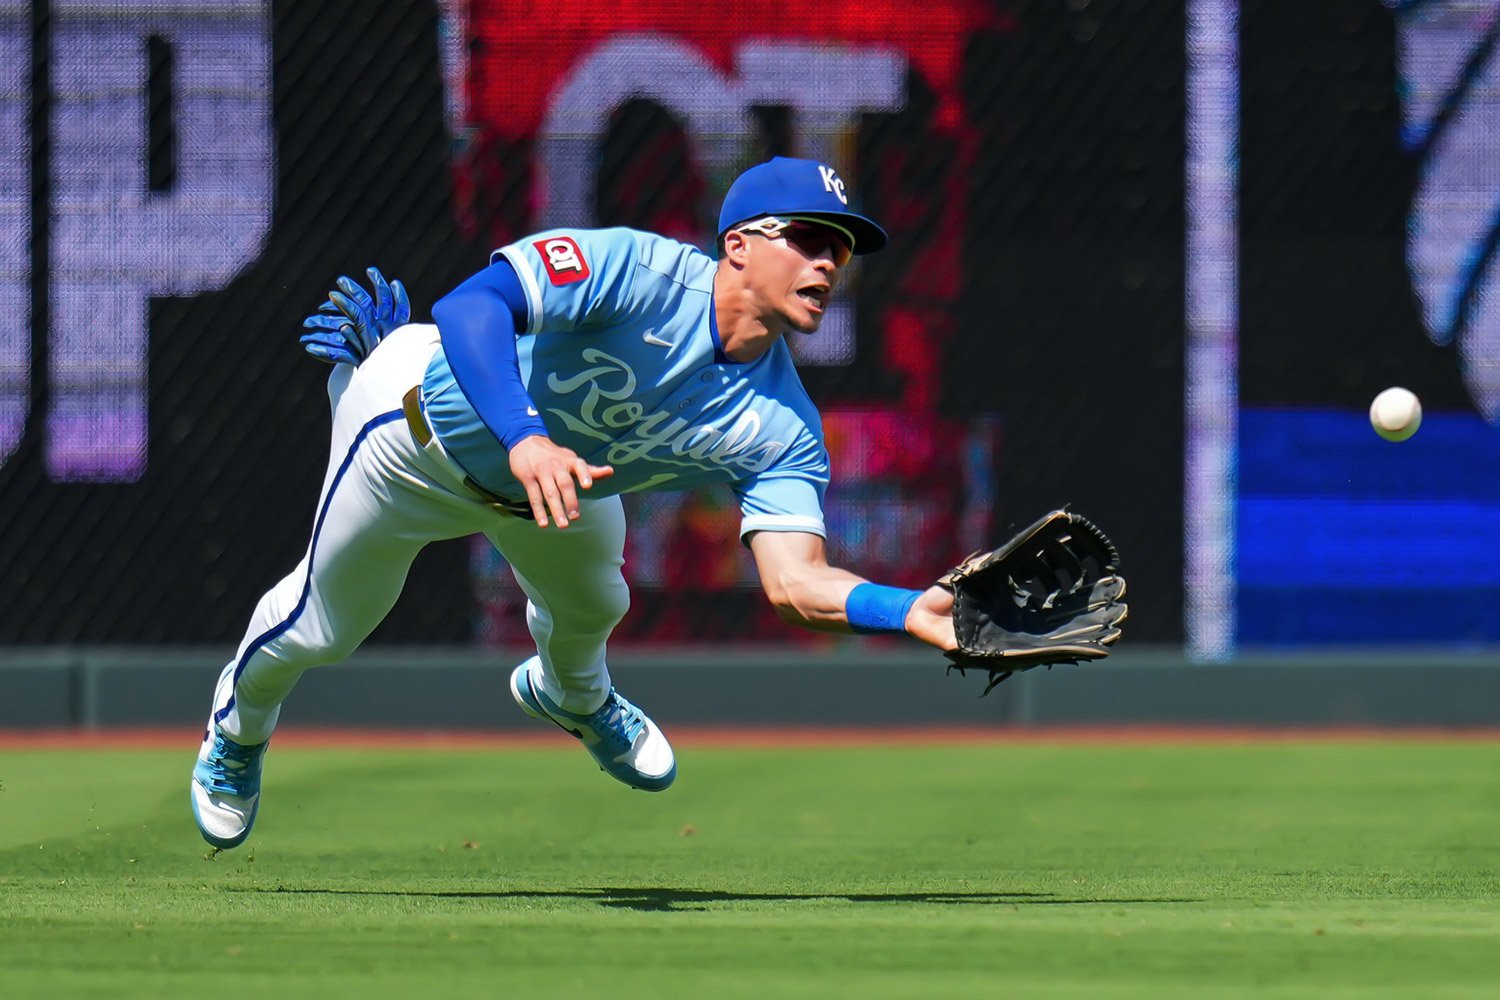 For much of the season, Isaac Collins' performance has raised a difficult question. How can a hitter who continues to control the strike zone, posts solid quality contact metrics, and owns some of the strongest plate-discipline indicators of his career produce so little offensively? The answer does not appear to be a loss of talent or physical decline. Nor does it stem from the disappearance of the skills that fueled his breakout campaign with Milwaukee in 2025. Instead, the numbers point to something more subtle. Collins is still doing many things well, but a combination of passivity in the strike zone, increased swing-and-miss issues in key situations, and a less efficient contact profile has eroded his offensive value. The disappointment is understandable. Kansas City acquired a player coming off a .263/.368/.411 season that was good for a 122 wRC+ and 2.6 WAR, a performance that established him as one of the Brewers’ most unexpected success stories. Since arriving in Kansas City, however, his production has fallen sharply, turning him into a clearly below-average offensive player. Season PA AVG OBP SLG wRC+ WAR 2025 (MIL) 441 .263 .368 .411 122 2.6 2026 (KC) 217 .212 .335 .302 84 -0.4 At first glance, that decline seems to support the idea that Collins has simply regressed after a season that exceeded his true talent level. A closer look at the underlying metrics, however, tells a more complicated story. His walk rate has actually improved from 12.9% to 13.8%. His barrel rate has climbed from 4.9% to 7.9%. Hard-hit rate has remained virtually unchanged, slipping only from 38.9% to 37.8%, while his average exit velocity has held steady. Even his expected metrics paint a far less severe picture than the one reflected in his traditional slash line. In other words, Collins does not look like a hitter who has suddenly lost the ability to impact the baseball. Several of the indicators that tend to predict future success remain relatively encouraging. The problem is that those strengths are being undermined by changes in the way he is constructing his plate appearances. During his breakout season in Milwaukee, Collins found a valuable balance. His discipline allowed him to avoid chasing pitches outside the zone, but he was also aggressive enough to attack strikes he could handle. That combination helped him work favorable counts and produce quality contact. The 2026 version looks different. His chase rate has barely changed, a strong indication that his plate discipline remains intact. The difference lies within the strike zone itself. Collins is swinging at fewer strikes than he did a year ago and, more importantly, he is allowing significantly more pitches in the heart of the zone to pass without a swing. Metric 2025 2026 Z-Swing% 64.4% 58.3% Heart Swing% 76.1% 65.8% Called Strike% 17.4% 19.6% CSW% 26.4% 28.6% Strikeout Rate 21.1% 25.8% The significance of those numbers extends well beyond a simple discussion about aggressiveness. Collins is not struggling because he is chasing more bad pitches. He is struggling because he is allowing too many good pitches to go by. Every hittable strike he takes increases the likelihood of falling behind in the count. Once the pitcher gains the advantage, the entire dynamic of the plate appearance changes. More breaking balls appear, more offspeed pitches enter the mix, and the hitter is forced into a reactive approach rather than an attacking one. That sequence helps explain another trend that repeatedly shows up in his numbers. While Collins continues to make respectable contact against fastballs, his swing-and-miss rates against breaking and offspeed pitches have become increasingly concerning. When he falls behind in the count, opposing pitchers gain more opportunities to exploit those vulnerabilities, and the rise in his strikeout rate is the natural consequence. The damage, however, does not stop there. Once the ball is put in play, Collins’ contact profile looks dramatically different from the one that fueled his success in Milwaukee. If there is a single statistic that best captures the difference between the two versions of Collins, it is probably the distribution of his batted balls. Season Line Drive% Ground Ball% Fly Ball% BABIP 2025 24.6% 41.1% 34.3% .326 2026 16.8% 32.8% 50.4% .287 A decline of nearly eight percentage points in line-drive rate represents a major red flag. For a hitter with Collins’ profile, line drives are the foundation of offensive success. His value has never been built around elite power. At his best, he generated hard contact on productive trajectories, producing hits consistently while maximizing his ability to reach base. That profile has largely disappeared. His fly-ball rate has jumped by more than sixteen percentage points compared to last season, while his line-drive rate has collapsed. The consequences have been immediate: fewer hits, fewer extra-base hits, and a substantial drop in BABIP. What makes the situation particularly interesting is that it helps reconcile two seemingly contradictory realities. On one hand, Collins continues to post respectable contact metrics. On the other hand, his production keeps declining. Both can be true at the same time. A hitter can still produce some loud contact and yet have a disappointing season if those opportunities become less frequent or if an increasing share of his batted balls turns into relatively harmless fly balls. That description fits Collins’ first few months in Kansas City remarkably well. Another factor that has deepened the decline has been his performance against left-handed pitching. Split AVG OBP SLG wRC+ vs. RHP .233 .382 .325 107 vs. LHP .169 .222 .254 30 While he remains reasonably productive against right-handers thanks to his ability to get on base, he has been one of the least effective hitters in baseball against left-handed pitching. The gap is so dramatic that it has significantly reduced his margin for error and limited his overall impact as a switch-hitter in the lineup. Even so, the most important conclusion is not that Collins has become a bad player. He continues to draw walks at an excellent rate, maintains contact-quality metrics that closely resemble last season’s numbers, and still possesses many of the skills that fueled his breakout in Milwaukee. What has changed is not the quality of those tools, but the way he is using them. In 2025, Collins forced pitchers to react to him. This season, far too often, the opposite has been true. By allowing more hittable strikes to pass, he has put himself in disadvantageous counts where breaking balls, swing-and-miss issues, and less productive contact begin to dictate the outcome of the plate appearance. That is why the solution likely does not require a complete overhaul or a dramatic mechanical adjustment. The Royals do not need a different player. They need the version of Collins that attacked hittable strikes and turned selective aggression into offensive production. Until that version returns, Kansas City will continue waiting for the hitter it believed it acquired over the winter.

