


Yirsandy Rodríguez
-
Posts
63 -
Joined
-
Last visited
-
Days Won
2
Content Type
Profiles
Forums
Blogs
Events
News
2026 Kansas City Royals Top Prospects Ranking
Kansas City Royals Videos
Kansas City Royals Free Agent & Trade Rumors, Notes, & Tidbits
Guides & Resources
2026 Kansas City Royals Draft Tracker: Picks & Bonuses
Store
Downloads
Gallery
Everything posted by Yirsandy Rodríguez
-
 I don’t think this Massey profile gives us much hope that he can add more power. He is relying on more contact, especially by using the whole field, and that’s great. His on-base percentage continues to improve, and that could be very important for his offensive role in the lineup. If he can sustain the best part of these adjustments alongside his elite defense, this could be great news for the future. Thanks for reading and commenting!
-
How Michael Massey Is Thriving By Making Less Contact
Yirsandy Rodríguez posted an article in Royals
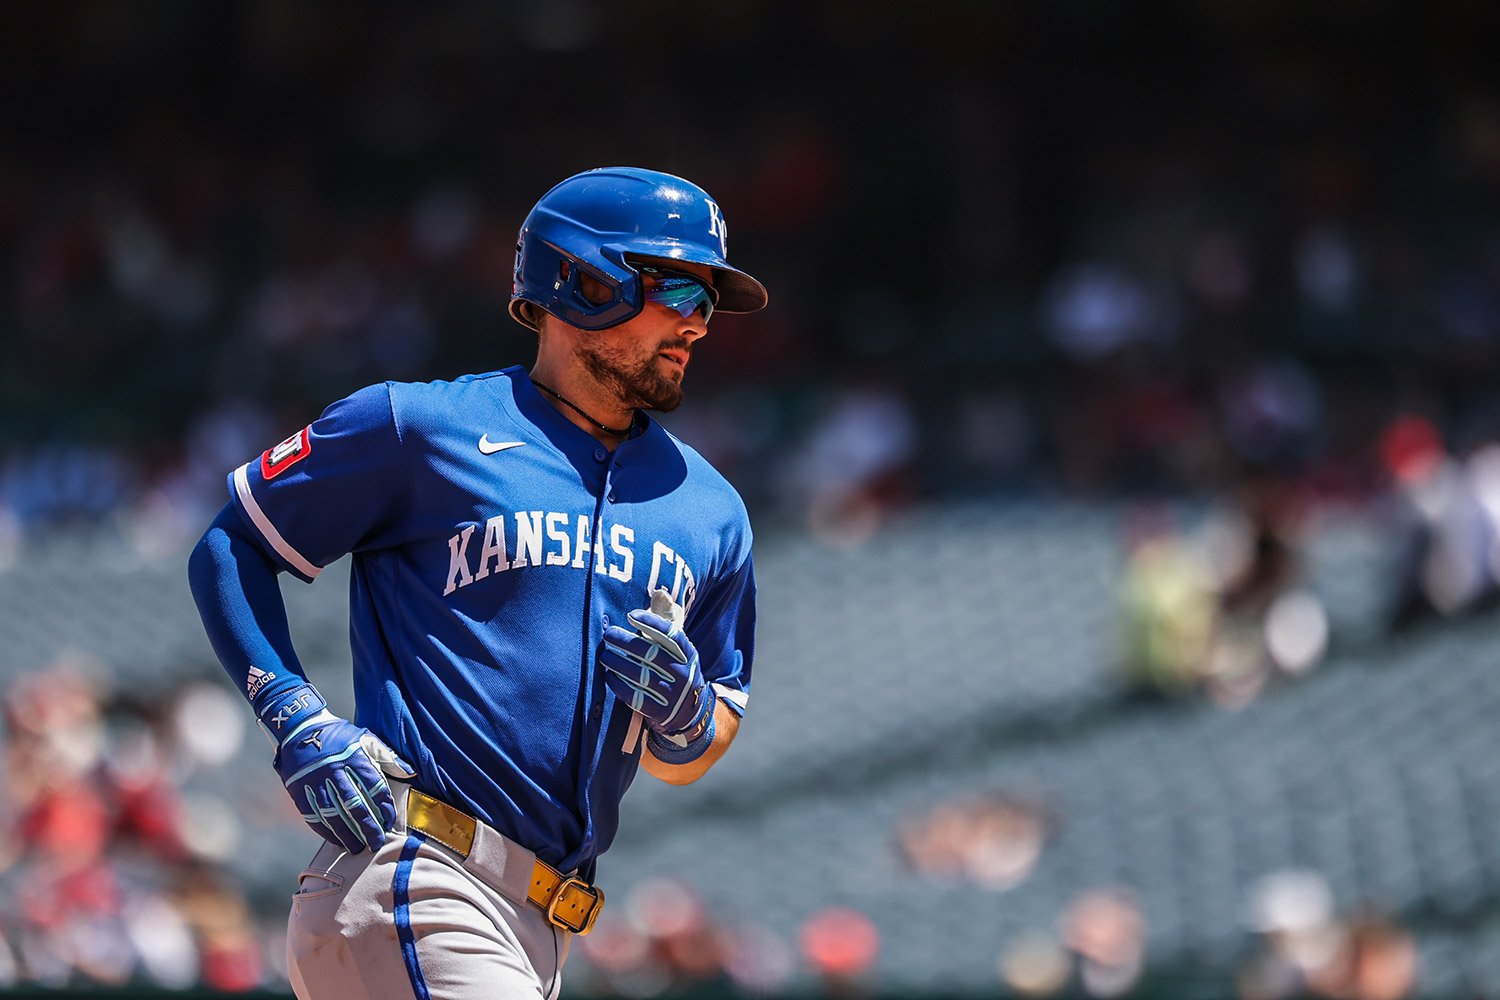 There are many doubts we can have around a baseball hitter, and one of the ones that creates the most expectations usually appears when he manages to erase one of his main problems at the plate. No matter how much he manages to distance himself from his historical inconsistencies, we remain attentive to the first sign of regression. Part of that narrative has been around Michael Massey's improvements in the batter's box this year, and we are already at the end of August. That means the final stretch of the season is approaching. At this point, many of the major trends among qualified hitters, whether good or bad, will be very difficult to reverse this late in the season. That makes Massey's story a much more reliable outcome. Throughout his career, since debuting with the Kansas City Royals in 2022, Massey has struggled against left-handed pitchers. Between 2022 and 2024, he averaged an 80 wRC+, with his improvement to 101 in 2024, but the following year he had the biggest drop of his career, recording just 41. His xSLG and xwOBA hit rock bottom, at .262 and .206, respectively. Massey's defensive ability at second base, forming a key combination with Bobby Witt Jr., along with his slight offensive impact against right-handed pitchers, justified part of his time as a starter. That story has taken a turn that seemed unsustainable, but has gradually become reality: Massey is posting a 140 wRC+, almost 100 points above his deepest drop last year, with an impressive .321/.346/.526 slash line, an .871 OPS and a .407 BABIP. Yes, it seems absurd, but he has increased his slugging by .249 points, his ISO by .162 (.205 from .043), his BABIP by .118 and his batting average by 87 points. Now, even more unusual is how he is doing it. Usually, this type of adjustment should be linked to better plate discipline, a higher contact rate both inside and outside the strike zone, and perhaps fewer strikeouts. What if I told you that Massey has done the exact opposite? It seems crazy, but he has broken all of those standards: his Contact% has fallen from 81.7% to 73.7%, his O-Contact% from 71.9% to 49.1%, he has increased his strikeout rate (K% from 18.4% to 25.6%) and has reduced his swings inside the strike zone by 9.1 percentage points (70.9% vs. 61.8%) compared with last year. Let's see how Massey has turned the tide in his favor in the lefty vs. lefty matchup, analyzing this 2025 vs. 2026 comparison: On the left, we have his 2025 heat map, and on the right, this season's. Notice how spread out the heat samples were last year. It is quite easy to notice how it has changed this year. This season, the intense heat points in the lower areas have a lot to do with the way Massey has hit the main pitches that neutralized him. In particular, he has made notable adjustments against sliders. Last year, his HardHit rate was just 22.2%, while Miss Distance reached 9.9, a combination that helps explain why his swing lost so much quality. This season, he has reduced that miss to an average of 3.2, with an xSLG of .438 and the highest hard-hit rate of his entire career (37.5%). His swings have not stopped being aggressive against sliders, and he has also paid the price with a 41.4% whiff rate, but the increase in quality at-bats has been worth it. Let's see here how Massey hit sliders. On the left are the results from this season. Compared with last year's samples, you can see how the opposition went back to attacking him in areas where they had controlled his swing. This year he has started to do damage in three different zones, two of them with an xBA above .750. Massey has received the highest percentage of pitches in the lower zones and toward the outside corner, so a key adjustment for him began by letting the pitches get to him. His bat speed stayed above 65 mph, and he also adjusted his launch angle from 21 degrees to 16. Against four-seam fastballs, the determining progress can be seen in IdealAtkAng%, which improved by 19.4%. Miss Distance has been reduced to 0.3, with better bat speed that has been reflected in a 4.6 increase in his HardHit% rate. Massey has also experienced improvements against the sinker, the pitch he was attacked with the most (4.4%) in 2025. This season, he has reduced his whiff rate by 7.1%, and his xSLG from .277 to .373. Look, there is something clear here, and that is that we do not know how long Massey will be able to maintain these adjustments. Left-handed pitchers have been throwing him too many fastballs and sliders, so I suspect that very soon we will begin to see a change in plan. Even so, the adjustment that could sustain this pace from Massey may be his total focus on contact. Since June, his BABIP has risen from .253 to .326, but the jump does not appear completely isolated: he is getting more line drives (24.6% from 13.3%), and his bat speed is allowing him to pull the ball more often (11.5%). For the first time, Massey is taking control in his matchups against left-handed pitchers, finally tasting the nectar of glory after walking back to the dugout with his head down so many times. Now it is no longer about knowing whether he can do it. The question is how long he will be able to sustain it.
-
Image courtesy of William Navarro-Imagn Images There are many doubts we can have around a baseball hitter, and one of the ones that creates the most expectations usually appears when he manages to erase one of his main problems at the plate. No matter how much he manages to distance himself from his historical inconsistencies, we remain attentive to the first sign of regression. Part of that narrative has been around Michael Massey's improvements in the batter's box this year, and we are already at the end of August. That means the final stretch of the season is approaching. At this point, many of the major trends among qualified hitters, whether good or bad, will be very difficult to reverse this late in the season. That makes Massey's story a much more reliable outcome. Throughout his career, since debuting with the Kansas City Royals in 2022, Massey has struggled against left-handed pitchers. Between 2022 and 2024, he averaged an 80 wRC+, with his improvement to 101 in 2024, but the following year he had the biggest drop of his career, recording just 41. His xSLG and xwOBA hit rock bottom, at .262 and .206, respectively. Massey's defensive ability at second base, forming a key combination with Bobby Witt Jr., along with his slight offensive impact against right-handed pitchers, justified part of his time as a starter. That story has taken a turn that seemed unsustainable, but has gradually become reality: Massey is posting a 140 wRC+, almost 100 points above his deepest drop last year, with an impressive .321/.346/.526 slash line, an .871 OPS and a .407 BABIP. Yes, it seems absurd, but he has increased his slugging by .249 points, his ISO by .162 (.205 from .043), his BABIP by .118 and his batting average by 87 points. Now, even more unusual is how he is doing it. Usually, this type of adjustment should be linked to better plate discipline, a higher contact rate both inside and outside the strike zone, and perhaps fewer strikeouts. What if I told you that Massey has done the exact opposite? It seems crazy, but he has broken all of those standards: his Contact% has fallen from 81.7% to 73.7%, his O-Contact% from 71.9% to 49.1%, he has increased his strikeout rate (K% from 18.4% to 25.6%) and has reduced his swings inside the strike zone by 9.1 percentage points (70.9% vs. 61.8%) compared with last year. Let's see how Massey has turned the tide in his favor in the lefty vs. lefty matchup, analyzing this 2025 vs. 2026 comparison: On the left, we have his 2025 heat map, and on the right, this season's. Notice how spread out the heat samples were last year. It is quite easy to notice how it has changed this year. This season, the intense heat points in the lower areas have a lot to do with the way Massey has hit the main pitches that neutralized him. In particular, he has made notable adjustments against sliders. Last year, his HardHit rate was just 22.2%, while Miss Distance reached 9.9, a combination that helps explain why his swing lost so much quality. This season, he has reduced that miss to an average of 3.2, with an xSLG of .438 and the highest hard-hit rate of his entire career (37.5%). His swings have not stopped being aggressive against sliders, and he has also paid the price with a 41.4% whiff rate, but the increase in quality at-bats has been worth it. Let's see here how Massey hit sliders. On the left are the results from this season. Compared with last year's samples, you can see how the opposition went back to attacking him in areas where they had controlled his swing. This year he has started to do damage in three different zones, two of them with an xBA above .750. Massey has received the highest percentage of pitches in the lower zones and toward the outside corner, so a key adjustment for him began by letting the pitches get to him. His bat speed stayed above 65 mph, and he also adjusted his launch angle from 21 degrees to 16. Against four-seam fastballs, the determining progress can be seen in IdealAtkAng%, which improved by 19.4%. Miss Distance has been reduced to 0.3, with better bat speed that has been reflected in a 4.6 increase in his HardHit% rate. Massey has also experienced improvements against the sinker, the pitch he was attacked with the most (4.4%) in 2025. This season, he has reduced his whiff rate by 7.1%, and his xSLG from .277 to .373. Look, there is something clear here, and that is that we do not know how long Massey will be able to maintain these adjustments. Left-handed pitchers have been throwing him too many fastballs and sliders, so I suspect that very soon we will begin to see a change in plan. Even so, the adjustment that could sustain this pace from Massey may be his total focus on contact. Since June, his BABIP has risen from .253 to .326, but the jump does not appear completely isolated: he is getting more line drives (24.6% from 13.3%), and his bat speed is allowing him to pull the ball more often (11.5%). For the first time, Massey is taking control in his matchups against left-handed pitchers, finally tasting the nectar of glory after walking back to the dugout with his head down so many times. Now it is no longer about knowing whether he can do it. The question is how long he will be able to sustain it. View full article
-
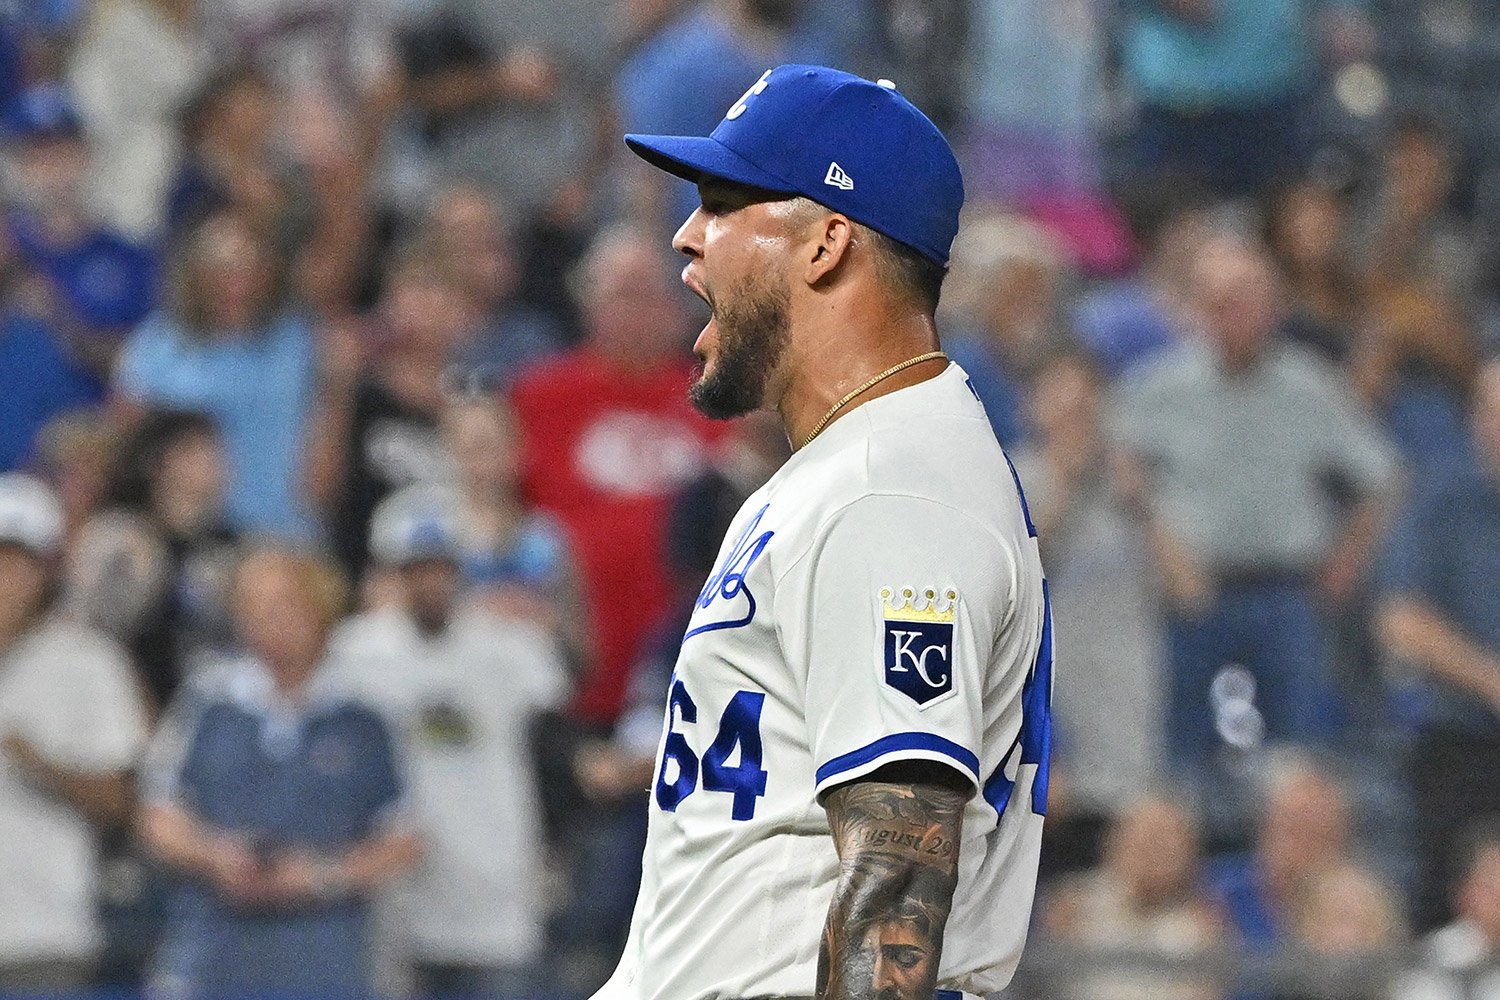 When you watch Kansas City Royals right-hander Steven Cruz pitch, there are two conclusions we can draw without checking his Baseball Savant page: he has one of the fastest fastballs in the league, but his velocity still isn’t enough to dominate. Contrary to what Cruz’s 98.4 mph fastball average, the highest of his career and 96th percentile in velocity this season, invokes from the mound, hitters have a clear idea of how to take advantage of his shortcomings. Among the 16 qualified pitchers with at least 45 innings pitched and a 98 mph average fastball, Cruz has the fifth-best Whiff% (29%). Listen to the names ahead of him: Jacob Misiorowski (41.9%), Mason Miller (40.7%), Mason Montgomery (30.8%) and Juan Morillo (30.0%). He has left behind several elite relievers such as Adrian Morejon, Grant Taylor, Andrés Muñoz, Louis Varland, and Abner Uribe. Opponents have posted a .229 xBA against Cruz’s fastball, and with two strikes, it has accounted for 54.9% of his 51 strikeouts. On that side of the stat sheet, those numbers invoke a display of dominance. However, if we stay focused on that one part, we would not know the inconsistencies that have kept Cruz from making the jump to the first tier of the Royals’ bullpen. When we look at the other side, in reality, his fastball is not as dominant as those numbers suggest. There have been many situations in which Cruz has solved things with his high velocity, but his 147 wRC+ allowed exposes that his fastball has been more vulnerable in situations where he needs to avoid contact. Its Run Value is -2, and for the third consecutive year, its xSLG has climbed above .400. This year, opponents are hitting .409 xSLG against him, a figure that rises to .475 when the hitter is ahead in the count. The only situation in which Cruz’s fastball becomes unreachable is with two strikes, when opponents have gone 3-for-45, with no extra-base hits, and have struck out (28) in 57% of plate appearances (49). That said, there is no doubt that the fastball is not Cruz’s most dominant pitch. And that is the Dominican right-hander’s biggest assignment: he has one of the fastest fastballs in the game, but he still has not been able to turn that potential into becoming a dominant enough pitcher. For Cruz, who uses the fastball 55.5% of the time, this presents a bigger problem. His fastball should be the center of his arsenal and, around it, he should put the rest of his repertoire to work, which is reduced to just two more pitches: his cutter and slider. Fortunately for Cruz, the cutter has become his saving pitch: it has the only positive Run Value in his arsenal (5.0), produces ground balls 54.1% of the time, and the league averages just a 36 wRC+. The cutter has been his evolving weapon: he has improved its Whiff% to 32.2% this year, and reduced his Perfect Contact% from 28% last season to 18%, well below the 33% he allowed between 2023 and 2024. But there is one important aspect Cruz should work on around the cutter, and it comes as a consequence of an improvement by the opposition in increasing its Over rate to 23%. In 2024, the league averaged 4% against him, and 7% last year. To a large extent, that anticipation seems concerning, and it is not what usually happens when the hitter takes longer to identify the pitches, which could become an open door to contact. Part of that problem begins with Cruz’s slider, by far the most punished pitch in his arsenal. Opponents have posted a 157 wRC+ against it, making contact 92.3% of the time within the strike zone. The breakdown hitters are taking advantage of has a lot to do with the slider’s location, especially in the upper third of the strike zone. That poor history could explain Cruz’s reasonable lack of confidence, as he has lowered his slider usage from 11.1% in 2025 to 4.0% this season when hitters are ahead in the count. Without a real possibility of his highest-velocity pitch still standing out as his main weapon on the mound, the cutter has taken center stage in Cruz’s arsenal. However, at the same time, it has been overexposed because the slider is far from being a reliable pitch. That is Cruz’s dilemma. His potential brings us closer to the idea that he has enough to make the jump to the elite level, but the fastball that should drive his arsenal still hasn’t quite done it. The cutter has had to take on part of that role, while the slider’s problems continue to prevent him from sustaining that dominance.
-
Image courtesy of Peter Aiken-Imagn Images When you watch Kansas City Royals right-hander Steven Cruz pitch, there are two conclusions we can draw without checking his Baseball Savant page: he has one of the fastest fastballs in the league, but his velocity still isn’t enough to dominate. Contrary to what Cruz’s 98.4 mph fastball average, the highest of his career and 96th percentile in velocity this season, invokes from the mound, hitters have a clear idea of how to take advantage of his shortcomings. Among the 16 qualified pitchers with at least 45 innings pitched and a 98 mph average fastball, Cruz has the fifth-best Whiff% (29%). Listen to the names ahead of him: Jacob Misiorowski (41.9%), Mason Miller (40.7%), Mason Montgomery (30.8%) and Juan Morillo (30.0%). He has left behind several elite relievers such as Adrian Morejon, Grant Taylor, Andrés Muñoz, Louis Varland, and Abner Uribe. Opponents have posted a .229 xBA against Cruz’s fastball, and with two strikes, it has accounted for 54.9% of his 51 strikeouts. On that side of the stat sheet, those numbers invoke a display of dominance. However, if we stay focused on that one part, we would not know the inconsistencies that have kept Cruz from making the jump to the first tier of the Royals’ bullpen. When we look at the other side, in reality, his fastball is not as dominant as those numbers suggest. There have been many situations in which Cruz has solved things with his high velocity, but his 147 wRC+ allowed exposes that his fastball has been more vulnerable in situations where he needs to avoid contact. Its Run Value is -2, and for the third consecutive year, its xSLG has climbed above .400. This year, opponents are hitting .409 xSLG against him, a figure that rises to .475 when the hitter is ahead in the count. The only situation in which Cruz’s fastball becomes unreachable is with two strikes, when opponents have gone 3-for-45, with no extra-base hits, and have struck out (28) in 57% of plate appearances (49). That said, there is no doubt that the fastball is not Cruz’s most dominant pitch. And that is the Dominican right-hander’s biggest assignment: he has one of the fastest fastballs in the game, but he still has not been able to turn that potential into becoming a dominant enough pitcher. For Cruz, who uses the fastball 55.5% of the time, this presents a bigger problem. His fastball should be the center of his arsenal and, around it, he should put the rest of his repertoire to work, which is reduced to just two more pitches: his cutter and slider. Fortunately for Cruz, the cutter has become his saving pitch: it has the only positive Run Value in his arsenal (5.0), produces ground balls 54.1% of the time, and the league averages just a 36 wRC+. The cutter has been his evolving weapon: he has improved its Whiff% to 32.2% this year, and reduced his Perfect Contact% from 28% last season to 18%, well below the 33% he allowed between 2023 and 2024. But there is one important aspect Cruz should work on around the cutter, and it comes as a consequence of an improvement by the opposition in increasing its Over rate to 23%. In 2024, the league averaged 4% against him, and 7% last year. To a large extent, that anticipation seems concerning, and it is not what usually happens when the hitter takes longer to identify the pitches, which could become an open door to contact. Part of that problem begins with Cruz’s slider, by far the most punished pitch in his arsenal. Opponents have posted a 157 wRC+ against it, making contact 92.3% of the time within the strike zone. The breakdown hitters are taking advantage of has a lot to do with the slider’s location, especially in the upper third of the strike zone. That poor history could explain Cruz’s reasonable lack of confidence, as he has lowered his slider usage from 11.1% in 2025 to 4.0% this season when hitters are ahead in the count. Without a real possibility of his highest-velocity pitch still standing out as his main weapon on the mound, the cutter has taken center stage in Cruz’s arsenal. However, at the same time, it has been overexposed because the slider is far from being a reliable pitch. That is Cruz’s dilemma. His potential brings us closer to the idea that he has enough to make the jump to the elite level, but the fastball that should drive his arsenal still hasn’t quite done it. The cutter has had to take on part of that role, while the slider’s problems continue to prevent him from sustaining that dominance. View full article
-
The Adjustment That Is Changing Isaac Collins’ Season
Yirsandy Rodríguez posted an article in Royals
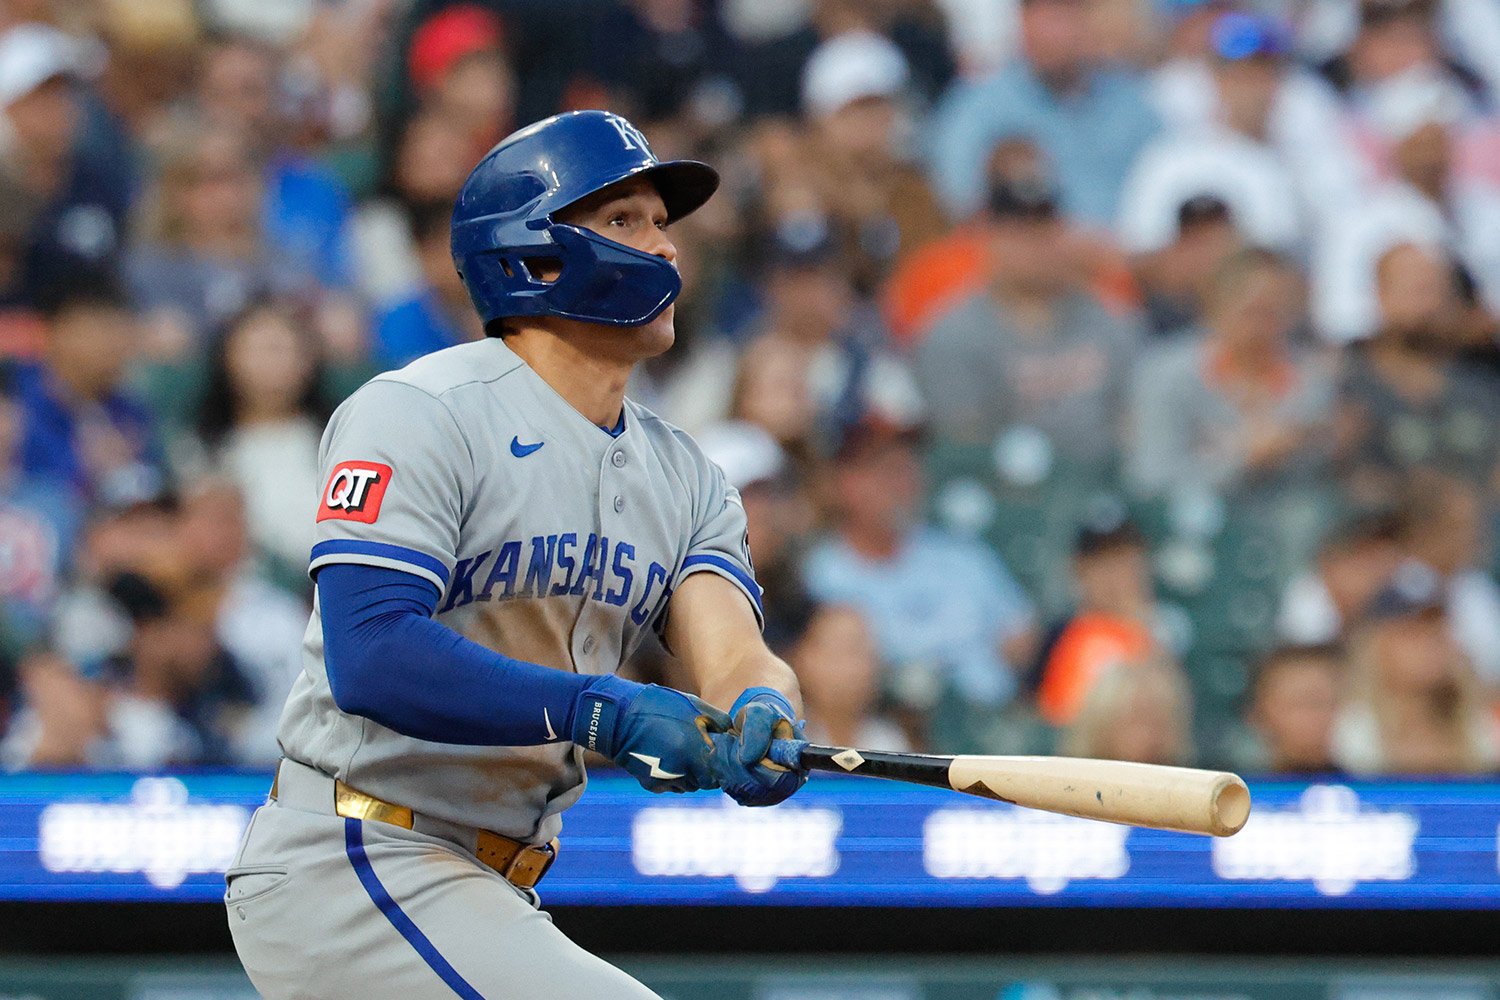 A couple of months ago, I analyzed Isaac Collins’ terrible start in his first season with the Kansas City Royals. The problem was evident: as a hitter, Collins depends on his contact ability, his ability to get on base, and the instincts he developed stealing bases during his final season with the Milwaukee Brewers. Contrary to that profile, the Collins we had seen through mid-June was having trouble putting the ball in play. His strikeouts increased by 4.7% compared to 2025, his slugging percentage dropped from .411 to .302, and his wRC+ (84) was below the league average. Collins is not a hitter who finds success hitting fly balls, so there was an obvious problem in his swing: his fly-ball rate jumped from 34.3% to 50.4%. As he approached the third month of the season, it was time to make adjustments. The big question here was how Collins was going to solve his main inconsistency. Was it worth changing his plan as a hitter? What part of his approach at the plate needed an immediate adjustment? In the two months since the last time we analyzed him, Collins found answers. For many hitters, it might seem reasonable to work on their plate discipline, be less aggressive and more selective, especially as a switch-hitter. Collins did the opposite: he turned aggression outside the zone into better contact. How did he do it? Let’s begin by looking at some revealing numbers: PERIOD K% xSLG BABIP Whiff% Hard-Hit% O-Swing% O-Contact% Contact% Opening Day to 6/12/2026 25.8 .308 .295 26.0 39.6 21.9% 53.1% 76.5% 6/13/2026 to 8/13/2026 17.1 .352 .295 16.8 40.8 26.7% 67.0% 83.8% DIFFERENCE -8.7 .044 .000 -9.2 1.2 4.8% 13.9% 7.3% Everything revolved around contact, but the key was not greater bat speed or a jump in power. Collins has given his season a positive turn since June 13 with greater aggression at the plate. His biggest increase in a metric was the 13.9% increase in O-Contact%, while he reduced his strikeout and Whiff rates. The quality of contact was also key to improving his xSLG from .308 to .352, while maintaining the same .295 BABIP. Yes, this really is not what is expected from a hitter who went through struggles at the beginning of the season. However, the adjustment process itself is nothing new for Collins. In the sample since 2025, he appears among the hitters with the greatest ability to generate value against pitches outside the strike zone: his .514 xOBP ranks sixth among qualified hitters who have seen at least 250 pitches outside the zone. Player xOBP Whiff% Barrel/BBE% Perdomo, Geraldo .568 24.4 1.3 Torres, Gleyber .567 39.1 2.2 Tucker, Kyle .562 41.9 2.3 Soto, Juan .540 40.9 8.1 Grisham, Trent .538 43.1 5.0 Collins, Isaac .514 49.7 0.0 Ward, Taylor .505 49.4 1.2 Vargas, Miguel .500 32.7 3.7 Bregman, Alex .500 32.4 0.8 Acuña Jr., Ronald .497 42.5 5.3 In the Top 10, there are two aspects that perfectly reveal Collins’ profile: he is the hitter with the highest Whiff% rate and the only one with 0.0 Barrel/BBE%. And there is the real story of his adjustment. As a hitter, Collins has remained faithful to the approach that made him an interesting piece for an offense that has achieved the highest Z-Contact% (86.1) in all of Major League Baseball this season. The big question that remains here is whether Collins can sustain this success by living off continued aggression and contact against pitches outside the strike zone. His xwOBA has not had an alarming drop (it went from .305 to .299 during the period of these last two months), while his Barrel% went from 7.5% to 4.0%. Since we already know that Collins’ philosophy is to live off contact, I investigated what the most notable differences have been within his recent offensive rebound. I focused more on his plate appearances against right-handed pitchers, since we have a larger sample there during the two periods we are analyzing. Opening Day to June 12 June 13 To August 13 Collins shows better performance in the second period, accumulating a value of +3.8 over +2.4. His hitting profile was more balanced, especially outside the strike zone, where contact has made the difference since June 13. Let’s look at some of those contacts against pitches up and outside the strike zone. Date: 2026-06-10. Pitcher: Gray, Peyton. Count: 1 – 2. Pitch Type: CH. Velocity: 84.5. URL: Isaac Collins doubles (8) on a line drive to left fielder Wyatt Langford. | Baseball Savant Videos | baseballsavant.com Date: 2026-06-19. Pitcher: McGreevy, Michael. Count: 1 – 2. Pitch Type: FF. Velocity: 91.9. URL: Isaac Collins' two-run double | Baseball Savant Videos | baseballsavant.com Two pieces of hitting in the Collins style! This season, only 18 left-handed hitters have hit a double with a pitch located in that same area. Shohei Ohtani leads the league with four. Collins is in the group of 15 hitters who have two. It is not so easy to get a piece of hitting like that. But for Collins, that is not the point that matters. He will go after pitches outside the strike zone. In these last two months, that has been his best adjustment, and he has gotten many more quality at-bats. We will see if his swing will continue to stay alive outside the zone. The Royals, despite having been in a terrible season, brought Collins in to continue being faithful to his style.
-
Image courtesy of Rick Osentoski-Imagn Images A couple of months ago, I analyzed Isaac Collins’ terrible start in his first season with the Kansas City Royals. The problem was evident: as a hitter, Collins depends on his contact ability, his ability to get on base, and the instincts he developed stealing bases during his final season with the Milwaukee Brewers. Contrary to that profile, the Collins we had seen through mid-June was having trouble putting the ball in play. His strikeouts increased by 4.7% compared to 2025, his slugging percentage dropped from .411 to .302, and his wRC+ (84) was below the league average. Collins is not a hitter who finds success hitting fly balls, so there was an obvious problem in his swing: his fly-ball rate jumped from 34.3% to 50.4%. As he approached the third month of the season, it was time to make adjustments. The big question here was how Collins was going to solve his main inconsistency. Was it worth changing his plan as a hitter? What part of his approach at the plate needed an immediate adjustment? In the two months since the last time we analyzed him, Collins found answers. For many hitters, it might seem reasonable to work on their plate discipline, be less aggressive and more selective, especially as a switch-hitter. Collins did the opposite: he turned aggression outside the zone into better contact. How did he do it? Let’s begin by looking at some revealing numbers: PERIOD K% xSLG BABIP Whiff% Hard-Hit% O-Swing% O-Contact% Contact% Opening Day to 6/12/2026 25.8 .308 .295 26.0 39.6 21.9% 53.1% 76.5% 6/13/2026 to 8/13/2026 17.1 .352 .295 16.8 40.8 26.7% 67.0% 83.8% DIFFERENCE -8.7 .044 .000 -9.2 1.2 4.8% 13.9% 7.3% Everything revolved around contact, but the key was not greater bat speed or a jump in power. Collins has given his season a positive turn since June 13 with greater aggression at the plate. His biggest increase in a metric was the 13.9% increase in O-Contact%, while he reduced his strikeout and Whiff rates. The quality of contact was also key to improving his xSLG from .308 to .352, while maintaining the same .295 BABIP. Yes, this really is not what is expected from a hitter who went through struggles at the beginning of the season. However, the adjustment process itself is nothing new for Collins. In the sample since 2025, he appears among the hitters with the greatest ability to generate value against pitches outside the strike zone: his .514 xOBP ranks sixth among qualified hitters who have seen at least 250 pitches outside the zone. Player xOBP Whiff% Barrel/BBE% Perdomo, Geraldo .568 24.4 1.3 Torres, Gleyber .567 39.1 2.2 Tucker, Kyle .562 41.9 2.3 Soto, Juan .540 40.9 8.1 Grisham, Trent .538 43.1 5.0 Collins, Isaac .514 49.7 0.0 Ward, Taylor .505 49.4 1.2 Vargas, Miguel .500 32.7 3.7 Bregman, Alex .500 32.4 0.8 Acuña Jr., Ronald .497 42.5 5.3 In the Top 10, there are two aspects that perfectly reveal Collins’ profile: he is the hitter with the highest Whiff% rate and the only one with 0.0 Barrel/BBE%. And there is the real story of his adjustment. As a hitter, Collins has remained faithful to the approach that made him an interesting piece for an offense that has achieved the highest Z-Contact% (86.1) in all of Major League Baseball this season. The big question that remains here is whether Collins can sustain this success by living off continued aggression and contact against pitches outside the strike zone. His xwOBA has not had an alarming drop (it went from .305 to .299 during the period of these last two months), while his Barrel% went from 7.5% to 4.0%. Since we already know that Collins’ philosophy is to live off contact, I investigated what the most notable differences have been within his recent offensive rebound. I focused more on his plate appearances against right-handed pitchers, since we have a larger sample there during the two periods we are analyzing. Opening Day to June 12 June 13 To August 13 Collins shows better performance in the second period, accumulating a value of +3.8 over +2.4. His hitting profile was more balanced, especially outside the strike zone, where contact has made the difference since June 13. Let’s look at some of those contacts against pitches up and outside the strike zone. Date: 2026-06-10. Pitcher: Gray, Peyton. Count: 1 – 2. Pitch Type: CH. Velocity: 84.5. URL: Isaac Collins doubles (8) on a line drive to left fielder Wyatt Langford. | Baseball Savant Videos | baseballsavant.com Date: 2026-06-19. Pitcher: McGreevy, Michael. Count: 1 – 2. Pitch Type: FF. Velocity: 91.9. URL: Isaac Collins' two-run double | Baseball Savant Videos | baseballsavant.com Two pieces of hitting in the Collins style! This season, only 18 left-handed hitters have hit a double with a pitch located in that same area. Shohei Ohtani leads the league with four. Collins is in the group of 15 hitters who have two. It is not so easy to get a piece of hitting like that. But for Collins, that is not the point that matters. He will go after pitches outside the strike zone. In these last two months, that has been his best adjustment, and he has gotten many more quality at-bats. We will see if his swing will continue to stay alive outside the zone. The Royals, despite having been in a terrible season, brought Collins in to continue being faithful to his style. View full article
-
The Strange Case That Is Making Randy Dobnak's Lack Of Velocity Work
Yirsandy Rodríguez posted an article in Royals
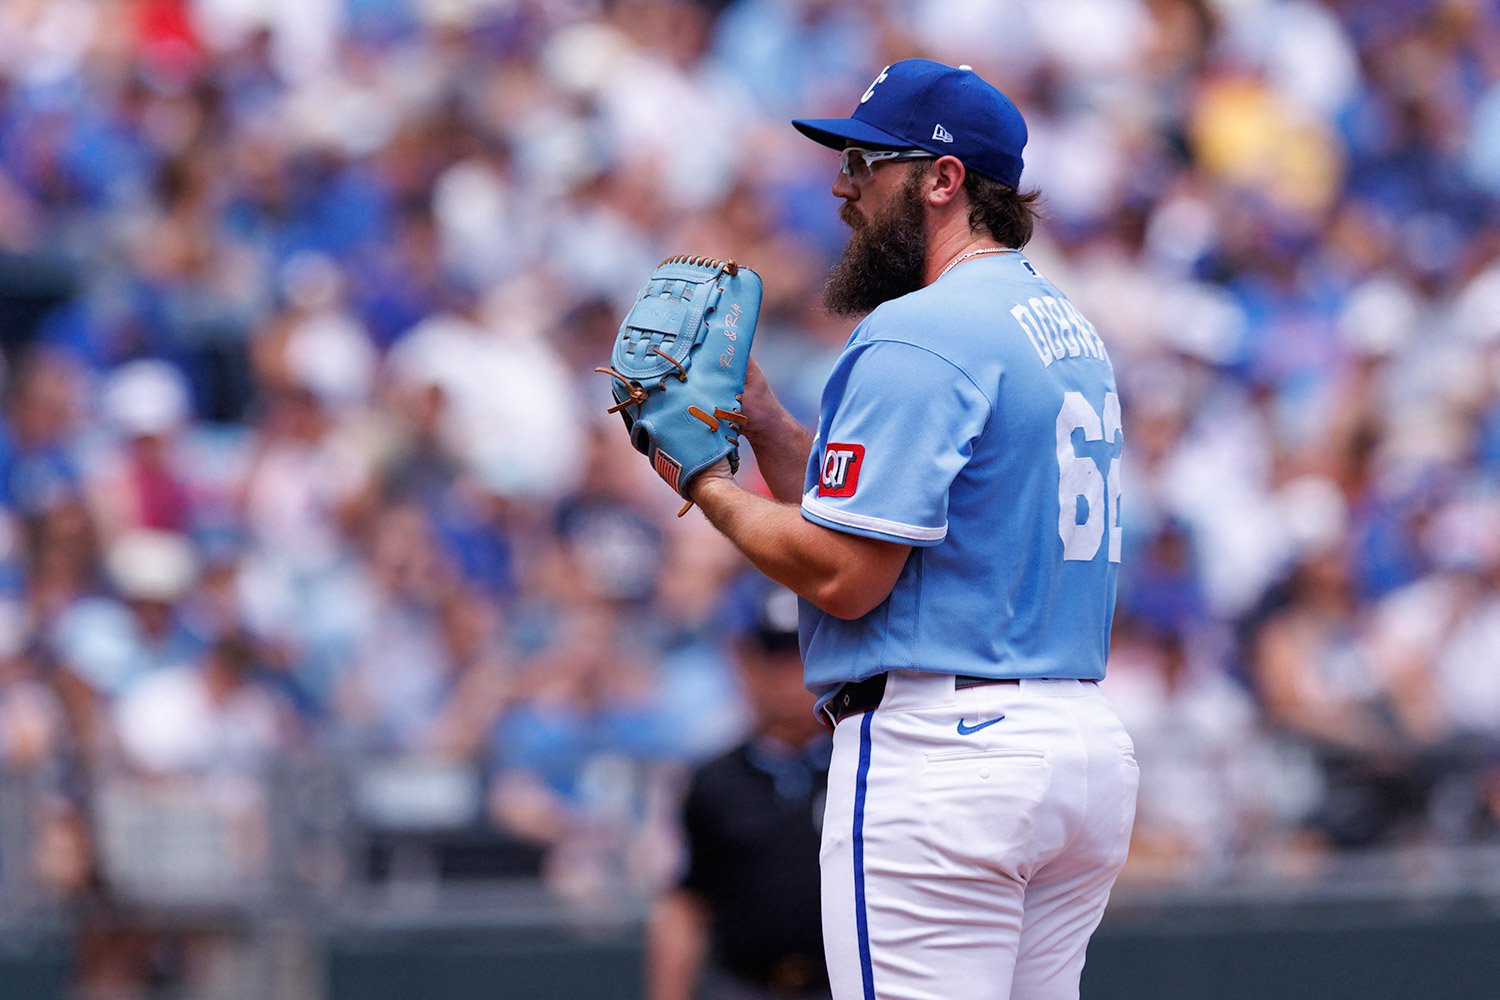 I don’t know if this has happened to you, but sometimes small samples can cause panic. Throughout his major league career, right-hander Randy Dobnak has had a few of them. The first time I saw Dobnak pitch this season was on July 2, during his debut with the Royals in relief against the Tampa Bay Rays at Kauffman Stadium. He entered after a terrible 42-pitch second inning from Stephen Kolek. The Tampa Bay Rays had taken a 3-0 lead. With Dobnak coming onto the mound, I had the feeling that his inning would be the inevitable reason to stop watching the game. I watched a couple more batters; Dobnak fell behind 2-1 in the count against Junior Caminero, but got him out on a groundball with a high sinker. One out. The next batter, Víctor Mesa Jr., grounded out to second on the first pitch, against a sinker on the outside corner. When it looked like everything was going to be fine, Chandler Simpson and Cedric Mullins collected back-to-back singles, and Taylor Walls walked. Bases loaded. On the first pitch, Richie Palacios missed a sinker away and hit a fly ball to left field. With a little scare, Dobnak escaped the third inning without allowing a run. He dominated the next five opponents and reached the fifth inning with two outs. Who cared about exit velocities? The man was getting outs! But just when everything seemed calm, Simpson and Mullins caught up with the sinker. Single and home run. The Rays extended their lead to 5-1. In the following inning, Dobnak allowed two more hits, but a great throw home by Isaac Collins cut down Hunter Feduccia at the plate to end the inning. Dobnak’s Royals debut was over. He threw four innings, allowing two runs with two strikeouts and one walk. He had seven baserunners and allowed two of them to score. That first look at Dobnak perfectly described the version of the pitcher he has been in the majors. When you look at his weapons against opposing hitters, you realize the contradiction contained in his profile: a pitcher whose fastball barely reaches 92 mph, with an insignificant strikeout rate and a lurking volume of contact allowed in the zone. Taken together, there is nothing that looks more vulnerable in a league where velocity and stuff occupy a central place. His 2021 season with the Minnesota Twins, when he had his biggest role as a reliever, confirms that reading with certainty: his hard-hit rate ranked in the first percentile of the league, along with a 10.3% barrel rate and a 6.81 xERA. So, how can a pitcher with that profile survive now? What were the desperate Royals looking at when they brought in Dobnak? Those were some of the inevitable questions following his debut in early July. The answer begins with his sinker, a pitch he uses 39.8% of the time. Yes, as contradictory as it may seem, the sinker is the starting point. When you look at Dobnak’s splits by count, there are some surprising things. Opponents have posted a .577 xSLG when ahead in the count, with a tiny 4.2% Whiff rate. Yet the result behind that devastating average tells another story. Batter Run Value tells us that the sinker is not being punished throughout the entire zone. There are six of the eight areas of the strike zone where the opposition has negative values. The efficiency inside the strike zone responds to the value that seems hidden in Dobnak’s sinker: his ability to generate groundballs. He does not have elite velocity or the ability to generate swings and misses frequently, but he makes up for that difference with location. And when opponents make contact, here is the success: he induces groundballs more than 67% of the time. Contrary to what we might believe when looking at the sinker’s results, Dobnak’s location problem has been outside the strike zone. Alongside the sinker, the sweeper and his changeup are the pitches that strengthen the plan. With the sweeper, Dobnak has posted his highest Whiff rate (35.5%), making it his two-strike weapon, while the changeup is his most efficient pitch. When opponents make contact with the sweeper, the xSLG jumps to .448, making it even more vulnerable than the sinker (.444). Against the changeup? Just .278, with an average exit velocity of 83.1 mph. The sweeper is most effective when it is out of the hitter’s reach, but when Dobnak misses with it, the result has been terrifying. Bat Tracking data helps explain why that difference is so important. Hitters have averaged a 4.6-inch Miss Distance against Dobnak’s sweeper, while the four-seam fastball (0.9) and sinker (2.0) remain the pitches opponents read best. The Perfect Contact% against the sinker (47%) and fastball (42%) is at its worst for Dobnak, but his ability to generate groundballs and maintain location on the corners has prevented major problems. That explains how Dobnak can survive without velocity, and I believe his uncommon profile was the reason the Royals have tested him as a starter. The result, considering his arsenal, has been surprising. Dobnak has allowed more than one run in only one start, and it came in his most recent outing, on August 9 against the Cubs. He has allowed just one home run against 136 opponents, has a .271 BABIP, and maintains a 55.1% groundball rate. His 2.00 ERA tells a story of success since he arrived in Kansas City, while his 4.79 xERA predicts that he has been too lucky. In an era when velocity has become a pitcher’s indispensable antidote, every inch matters for Dobnak because he does not have many other tools to compensate for a bad location.
-
Image courtesy of William Purnell-Imagn Images I don’t know if this has happened to you, but sometimes small samples can cause panic. Throughout his major league career, right-hander Randy Dobnak has had a few of them. The first time I saw Dobnak pitch this season was on July 2, during his debut with the Royals in relief against the Tampa Bay Rays at Kauffman Stadium. He entered after a terrible 42-pitch second inning from Stephen Kolek. The Tampa Bay Rays had taken a 3-0 lead. With Dobnak coming onto the mound, I had the feeling that his inning would be the inevitable reason to stop watching the game. I watched a couple more batters; Dobnak fell behind 2-1 in the count against Junior Caminero, but got him out on a groundball with a high sinker. One out. The next batter, Víctor Mesa Jr., grounded out to second on the first pitch, against a sinker on the outside corner. When it looked like everything was going to be fine, Chandler Simpson and Cedric Mullins collected back-to-back singles, and Taylor Walls walked. Bases loaded. On the first pitch, Richie Palacios missed a sinker away and hit a fly ball to left field. With a little scare, Dobnak escaped the third inning without allowing a run. He dominated the next five opponents and reached the fifth inning with two outs. Who cared about exit velocities? The man was getting outs! But just when everything seemed calm, Simpson and Mullins caught up with the sinker. Single and home run. The Rays extended their lead to 5-1. In the following inning, Dobnak allowed two more hits, but a great throw home by Isaac Collins cut down Hunter Feduccia at the plate to end the inning. Dobnak’s Royals debut was over. He threw four innings, allowing two runs with two strikeouts and one walk. He had seven baserunners and allowed two of them to score. That first look at Dobnak perfectly described the version of the pitcher he has been in the majors. When you look at his weapons against opposing hitters, you realize the contradiction contained in his profile: a pitcher whose fastball barely reaches 92 mph, with an insignificant strikeout rate and a lurking volume of contact allowed in the zone. Taken together, there is nothing that looks more vulnerable in a league where velocity and stuff occupy a central place. His 2021 season with the Minnesota Twins, when he had his biggest role as a reliever, confirms that reading with certainty: his hard-hit rate ranked in the first percentile of the league, along with a 10.3% barrel rate and a 6.81 xERA. So, how can a pitcher with that profile survive now? What were the desperate Royals looking at when they brought in Dobnak? Those were some of the inevitable questions following his debut in early July. The answer begins with his sinker, a pitch he uses 39.8% of the time. Yes, as contradictory as it may seem, the sinker is the starting point. When you look at Dobnak’s splits by count, there are some surprising things. Opponents have posted a .577 xSLG when ahead in the count, with a tiny 4.2% Whiff rate. Yet the result behind that devastating average tells another story. Batter Run Value tells us that the sinker is not being punished throughout the entire zone. There are six of the eight areas of the strike zone where the opposition has negative values. The efficiency inside the strike zone responds to the value that seems hidden in Dobnak’s sinker: his ability to generate groundballs. He does not have elite velocity or the ability to generate swings and misses frequently, but he makes up for that difference with location. And when opponents make contact, here is the success: he induces groundballs more than 67% of the time. Contrary to what we might believe when looking at the sinker’s results, Dobnak’s location problem has been outside the strike zone. Alongside the sinker, the sweeper and his changeup are the pitches that strengthen the plan. With the sweeper, Dobnak has posted his highest Whiff rate (35.5%), making it his two-strike weapon, while the changeup is his most efficient pitch. When opponents make contact with the sweeper, the xSLG jumps to .448, making it even more vulnerable than the sinker (.444). Against the changeup? Just .278, with an average exit velocity of 83.1 mph. The sweeper is most effective when it is out of the hitter’s reach, but when Dobnak misses with it, the result has been terrifying. Bat Tracking data helps explain why that difference is so important. Hitters have averaged a 4.6-inch Miss Distance against Dobnak’s sweeper, while the four-seam fastball (0.9) and sinker (2.0) remain the pitches opponents read best. The Perfect Contact% against the sinker (47%) and fastball (42%) is at its worst for Dobnak, but his ability to generate groundballs and maintain location on the corners has prevented major problems. That explains how Dobnak can survive without velocity, and I believe his uncommon profile was the reason the Royals have tested him as a starter. The result, considering his arsenal, has been surprising. Dobnak has allowed more than one run in only one start, and it came in his most recent outing, on August 9 against the Cubs. He has allowed just one home run against 136 opponents, has a .271 BABIP, and maintains a 55.1% groundball rate. His 2.00 ERA tells a story of success since he arrived in Kansas City, while his 4.79 xERA predicts that he has been too lucky. In an era when velocity has become a pitcher’s indispensable antidote, every inch matters for Dobnak because he does not have many other tools to compensate for a bad location. View full article
-
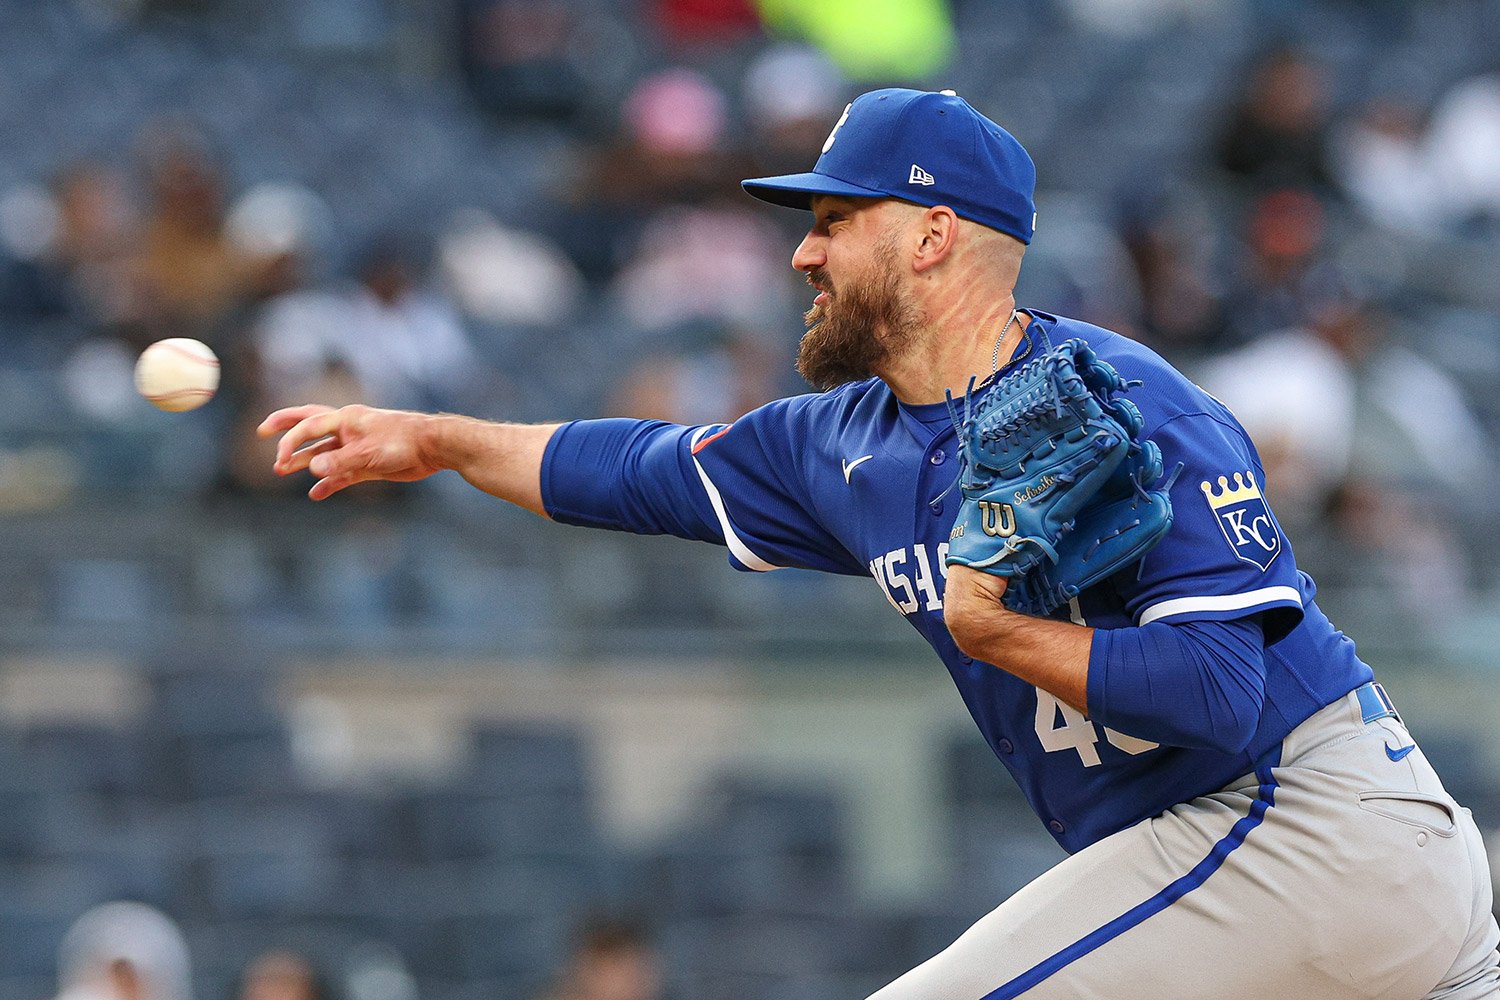 Two strikes should put the hitter on the defensive, but against the Kansas City bullpen, the exact opposite happens. The issue isn't getting ahead; it's finding the pitch to finish the plate appearance. A drop in secondary pitch effectiveness has completely eliminated the uncertainty in the batter's box. Without a breaking or offspeed offering that threatens the zone, hitters get comfortable, extend at-bats, and drive the ball hard—wiping out late-inning leads in the process. The numbers don't lie about the collapse: the Royals bullpen sits at the bottom of Major League Baseball with a disastrous -3.5 WAR and the lowest xERA (4.93) in the American League. They surrender 1.49 home runs per nine innings—the highest rate in MLB—while opponents punish them with a 40.4% hard-hit rate. This isn't a temporary slump limited to a couple of arms; it's a structural flaw in how the unit attempts to close out games. A year ago, a breaking pitch below the zone forced hitters to make split-second decisions. Today, they lay off with ease because they know the next pitch will have to come over the plate. Lucas Erceg's case illustrates it perfectly. Armed with a fastball that averages 97.2 mph, Erceg should freeze hitters when he's ahead in the count. Instead, his changeup has turned into a non-threat, yielding an astronomical 1.000 slugging percentage without generating a single strikeout. That means that, in that situation, the hitter can forget about emergency contact and most of the time look to do maximum damage against the changeup. That ineffective changeup disrupted his entire sequence. With one fewer variable to worry about, opposing batters no longer need to cover the bottom edge and can gear up early for the heater. The result is a damning .387 wOBA on Erceg's two-strike fastball. The velocity is still there. The deception is gone. John Schreiber, the most trusted and heavily used arm in the corps, reflects the very same issue. On paper, his 3.64 ERA (which drops to a microscopic 1.11 at home) masks the underlying damage. But when Schreiber gets ahead in the count and goes for his put-away pitch outside the zone, he loses command of the edges. The result has been so alarming that hitters have raised their meatball swing percentage to 83%, the highest mark of any season in his career with at least 700 pitches. Matt Strahm tells a similar tale. His slider lost its bite on the corners, allowing hitters to spit on it and sit dead-red on a fastball he is forced to throw for strikes—a pitch they are crushing to a .526 slugging percentage. Nick Mears represents the most extreme case. Every single home run he has surrendered would have left all 30 ballparks. Alex Lange and Eli Morgan exhibit the same trend, albeit on a smaller scale. Home runs aren't the problem. They are the visible consequence of everything that happened before. To save the final third of the game, Kansas City has had to turn to arms capable of dictating the pace of the matchup again through the quality of their secondary offerings. Enter Daniel Lynch IV and Steven Cruz, two relievers who regained control of plate appearances in different ways. While others try to impose themselves with the fastball, Lynch forces hitters to account for more than one possibility. Riding a sinker that holds opponents to a .140 average and a slider generating a 44.1% whiff rate, Lynch doesn't need dazzling velocity to survive because he keeps hitters off balance. In his game plan, that uncertainty has been worth more this year than a couple of extra miles per hour. Cruz, for his part, regained control by adding a cutter that forced opponents to account for two different speeds. Holding opponents to a .149 average with that pitch, his 98.6 mph fastball is making an impact again: hitters have to think twice before starting their swing. That is the flaw exposing this bullpen. Surrendering 1.53 home runs per nine innings alongside a 40.6% hard-hit rate is the consequence of running out of put-away pitches. The moment a hitter realizes the secondary pitch is no longer a threat, the at-bat no longer belongs to the pitcher.
- 2 comments
-
- 1
-

-
- lucas erceg
- john schreiber
- (and 7 more)
-
Image courtesy of Vincent Carchietta-Imagn Images Two strikes should put the hitter on the defensive, but against the Kansas City bullpen, the exact opposite happens. The issue isn't getting ahead; it's finding the pitch to finish the plate appearance. A drop in secondary pitch effectiveness has completely eliminated the uncertainty in the batter's box. Without a breaking or offspeed offering that threatens the zone, hitters get comfortable, extend at-bats, and drive the ball hard—wiping out late-inning leads in the process. The numbers don't lie about the collapse: the Royals bullpen sits at the bottom of Major League Baseball with a disastrous -3.5 WAR and the lowest xERA (4.93) in the American League. They surrender 1.49 home runs per nine innings—the highest rate in MLB—while opponents punish them with a 40.4% hard-hit rate. This isn't a temporary slump limited to a couple of arms; it's a structural flaw in how the unit attempts to close out games. A year ago, a breaking pitch below the zone forced hitters to make split-second decisions. Today, they lay off with ease because they know the next pitch will have to come over the plate. Lucas Erceg's case illustrates it perfectly. Armed with a fastball that averages 97.2 mph, Erceg should freeze hitters when he's ahead in the count. Instead, his changeup has turned into a non-threat, yielding an astronomical 1.000 slugging percentage without generating a single strikeout. That means that, in that situation, the hitter can forget about emergency contact and most of the time look to do maximum damage against the changeup. That ineffective changeup disrupted his entire sequence. With one fewer variable to worry about, opposing batters no longer need to cover the bottom edge and can gear up early for the heater. The result is a damning .387 wOBA on Erceg's two-strike fastball. The velocity is still there. The deception is gone. John Schreiber, the most trusted and heavily used arm in the corps, reflects the very same issue. On paper, his 3.64 ERA (which drops to a microscopic 1.11 at home) masks the underlying damage. But when Schreiber gets ahead in the count and goes for his put-away pitch outside the zone, he loses command of the edges. The result has been so alarming that hitters have raised their meatball swing percentage to 83%, the highest mark of any season in his career with at least 700 pitches. Matt Strahm tells a similar tale. His slider lost its bite on the corners, allowing hitters to spit on it and sit dead-red on a fastball he is forced to throw for strikes—a pitch they are crushing to a .526 slugging percentage. Nick Mears represents the most extreme case. Every single home run he has surrendered would have left all 30 ballparks. Alex Lange and Eli Morgan exhibit the same trend, albeit on a smaller scale. Home runs aren't the problem. They are the visible consequence of everything that happened before. To save the final third of the game, Kansas City has had to turn to arms capable of dictating the pace of the matchup again through the quality of their secondary offerings. Enter Daniel Lynch IV and Steven Cruz, two relievers who regained control of plate appearances in different ways. While others try to impose themselves with the fastball, Lynch forces hitters to account for more than one possibility. Riding a sinker that holds opponents to a .140 average and a slider generating a 44.1% whiff rate, Lynch doesn't need dazzling velocity to survive because he keeps hitters off balance. In his game plan, that uncertainty has been worth more this year than a couple of extra miles per hour. Cruz, for his part, regained control by adding a cutter that forced opponents to account for two different speeds. Holding opponents to a .149 average with that pitch, his 98.6 mph fastball is making an impact again: hitters have to think twice before starting their swing. That is the flaw exposing this bullpen. Surrendering 1.53 home runs per nine innings alongside a 40.6% hard-hit rate is the consequence of running out of put-away pitches. The moment a hitter realizes the secondary pitch is no longer a threat, the at-bat no longer belongs to the pitcher. View full article
-
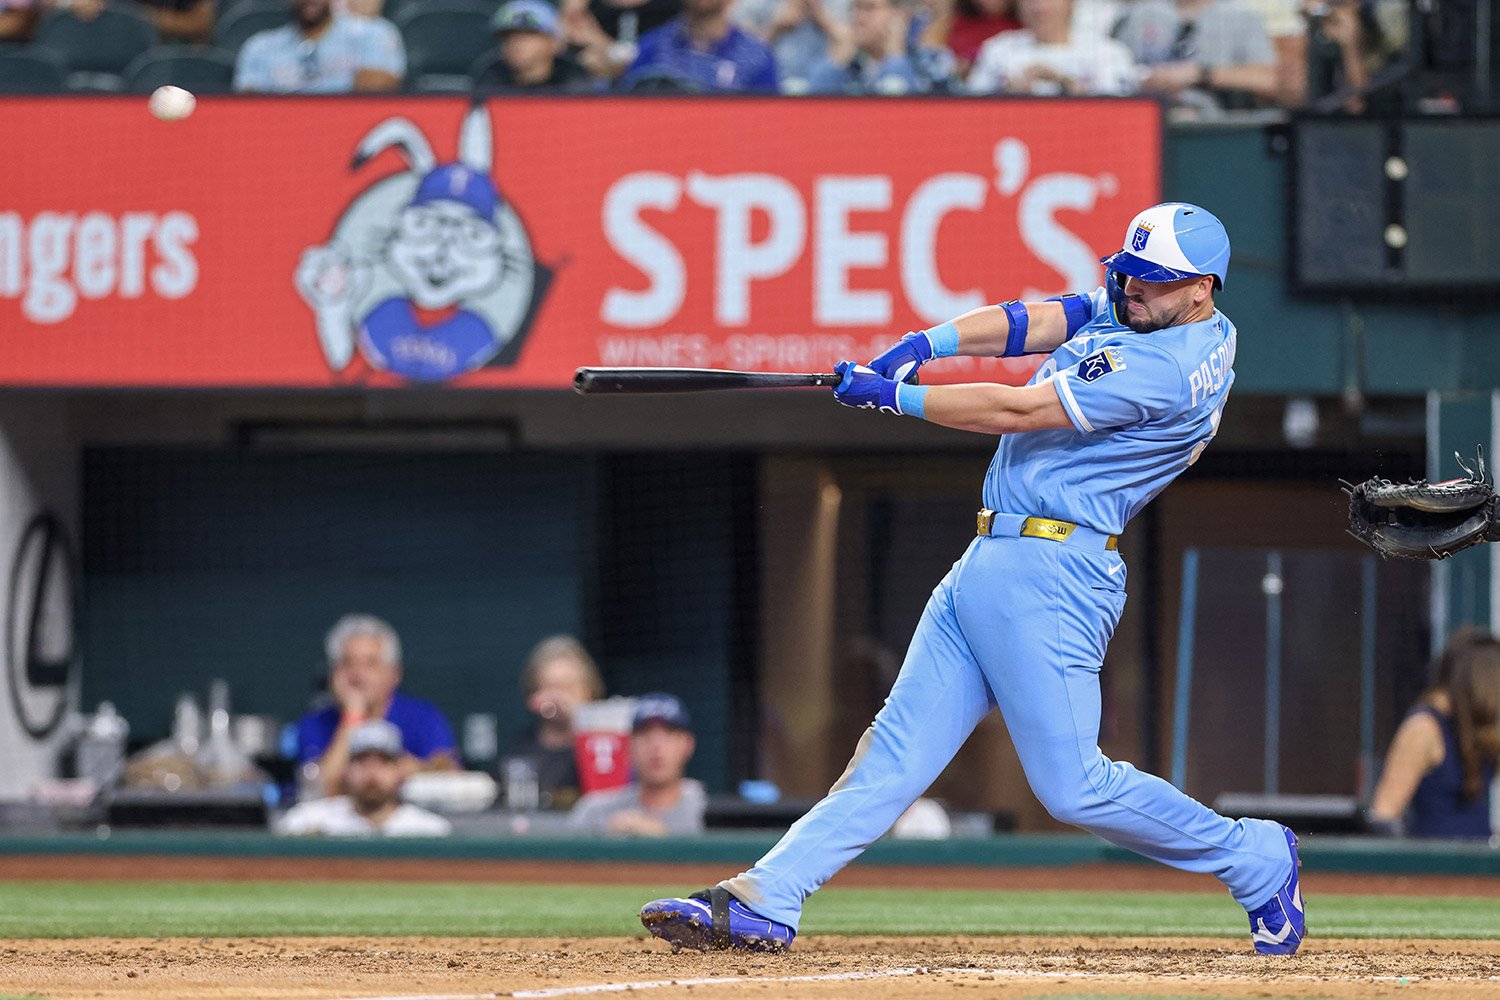 Vinnie Pasquantino's season is a reminder that controlling the strike zone is not enough when a hitter loses the ability to impact the baseball. He continues to make the decisions you'd expect from a middle-of-the-order hitter, but those decisions no longer produce the same kind of contact. The Royals first baseman rarely chases pitches outside the zone, owns a solid 11.0% walk rate, and makes contact on more than 90% of the pitches he sees in the strike zone. The swing that turned that disciplined approach into legitimate power over the past few seasons, however, is no longer producing the same results. Pasquantino's decline in bat speed has changed how left-handed pitchers can attack him. Against lefties, Pasquantino averages just 66.5 mph in bat speed—ranking in the fifth percentile across Major League Baseball. That has given opposing pitchers far more freedom to challenge him up and in or work the lower part of the strike zone without taking the same risks they once did. Pitches that previously demanded precise execution can now be thrown with much greater confidence because Pasquantino takes longer to get the barrel to the ball. The heat map illustrates that vulnerability. Outside of two quadrants in the upper portion of the strike zone, nearly the entire chart is shaded blue against left-handed pitching, including the area tight to his hands and much of the lower zone. Pitchers no longer need to live on the edges of the strike zone. They can attack him directly because that swing no longer punishes those pitches. The change is also evident in the type of contact he produces. Pasquantino still puts the ball in play, but he no longer moves the barrel through the zone with enough acceleration to transfer the same amount of energy at contact. The swing that once produced authoritative pulled fly balls to right field has largely disappeared against left-handed pitching. His PullAir% has fallen to 17.3%, while only 1.8% of his swings now qualify as Blast Swings. The split tells the story: Pitcher Split xwOBA Hard-Hit% Barrel% Bat Speed Whiff% vs. RHP .357 45.8% 7.9% 68.7 mph 13.8% vs. LHP .240 22.0% 1.7% 66.5 mph 22.4% Against right-handed pitching, Pasquantino still looks like the middle-of-the-order hitter the Royals expected, posting a .357 xwOBA alongside a 45.8% Hard-Hit rate. Against lefties, the profile changes completely. The drop in impact explains the rest of his offensive line: his Hard-Hit rate falls to 22.0%, barrels nearly disappear (1.7%), and his isolated power (ISO) has fallen from .211 to .113 compared to last season. Even his maximum exit velocity has declined from 114.4 mph to 108.1 mph. The change is also visible in his batted-ball profile, as 16.7% of his fly balls never even leave the infield. Pasquantino's season serves as a reminder that controlling the strike zone alone is not enough to sustain power. His plate discipline has returned to an elite level. The problem begins only after he decides to swing. As long as that physical gap remains, he'll continue to build quality plate appearances and lay off pitches he can't drive. What he can no longer guarantee—especially against left-handed pitching—is the kind of contact that makes a power-hitting first baseman the centerpiece of an offense and the hitter capable of changing a game with a single swing.
-
Image courtesy of IMAGN IMAGES via Reuters Connect Vinnie Pasquantino's season is a reminder that controlling the strike zone is not enough when a hitter loses the ability to impact the baseball. He continues to make the decisions you'd expect from a middle-of-the-order hitter, but those decisions no longer produce the same kind of contact. The Royals first baseman rarely chases pitches outside the zone, owns a solid 11.0% walk rate, and makes contact on more than 90% of the pitches he sees in the strike zone. The swing that turned that disciplined approach into legitimate power over the past few seasons, however, is no longer producing the same results. Pasquantino's decline in bat speed has changed how left-handed pitchers can attack him. Against lefties, Pasquantino averages just 66.5 mph in bat speed—ranking in the fifth percentile across Major League Baseball. That has given opposing pitchers far more freedom to challenge him up and in or work the lower part of the strike zone without taking the same risks they once did. Pitches that previously demanded precise execution can now be thrown with much greater confidence because Pasquantino takes longer to get the barrel to the ball. The heat map illustrates that vulnerability. Outside of two quadrants in the upper portion of the strike zone, nearly the entire chart is shaded blue against left-handed pitching, including the area tight to his hands and much of the lower zone. Pitchers no longer need to live on the edges of the strike zone. They can attack him directly because that swing no longer punishes those pitches. The change is also evident in the type of contact he produces. Pasquantino still puts the ball in play, but he no longer moves the barrel through the zone with enough acceleration to transfer the same amount of energy at contact. The swing that once produced authoritative pulled fly balls to right field has largely disappeared against left-handed pitching. His PullAir% has fallen to 17.3%, while only 1.8% of his swings now qualify as Blast Swings. The split tells the story: Pitcher Split xwOBA Hard-Hit% Barrel% Bat Speed Whiff% vs. RHP .357 45.8% 7.9% 68.7 mph 13.8% vs. LHP .240 22.0% 1.7% 66.5 mph 22.4% Against right-handed pitching, Pasquantino still looks like the middle-of-the-order hitter the Royals expected, posting a .357 xwOBA alongside a 45.8% Hard-Hit rate. Against lefties, the profile changes completely. The drop in impact explains the rest of his offensive line: his Hard-Hit rate falls to 22.0%, barrels nearly disappear (1.7%), and his isolated power (ISO) has fallen from .211 to .113 compared to last season. Even his maximum exit velocity has declined from 114.4 mph to 108.1 mph. The change is also visible in his batted-ball profile, as 16.7% of his fly balls never even leave the infield. Pasquantino's season serves as a reminder that controlling the strike zone alone is not enough to sustain power. His plate discipline has returned to an elite level. The problem begins only after he decides to swing. As long as that physical gap remains, he'll continue to build quality plate appearances and lay off pitches he can't drive. What he can no longer guarantee—especially against left-handed pitching—is the kind of contact that makes a power-hitting first baseman the centerpiece of an offense and the hitter capable of changing a game with a single swing. View full article
-
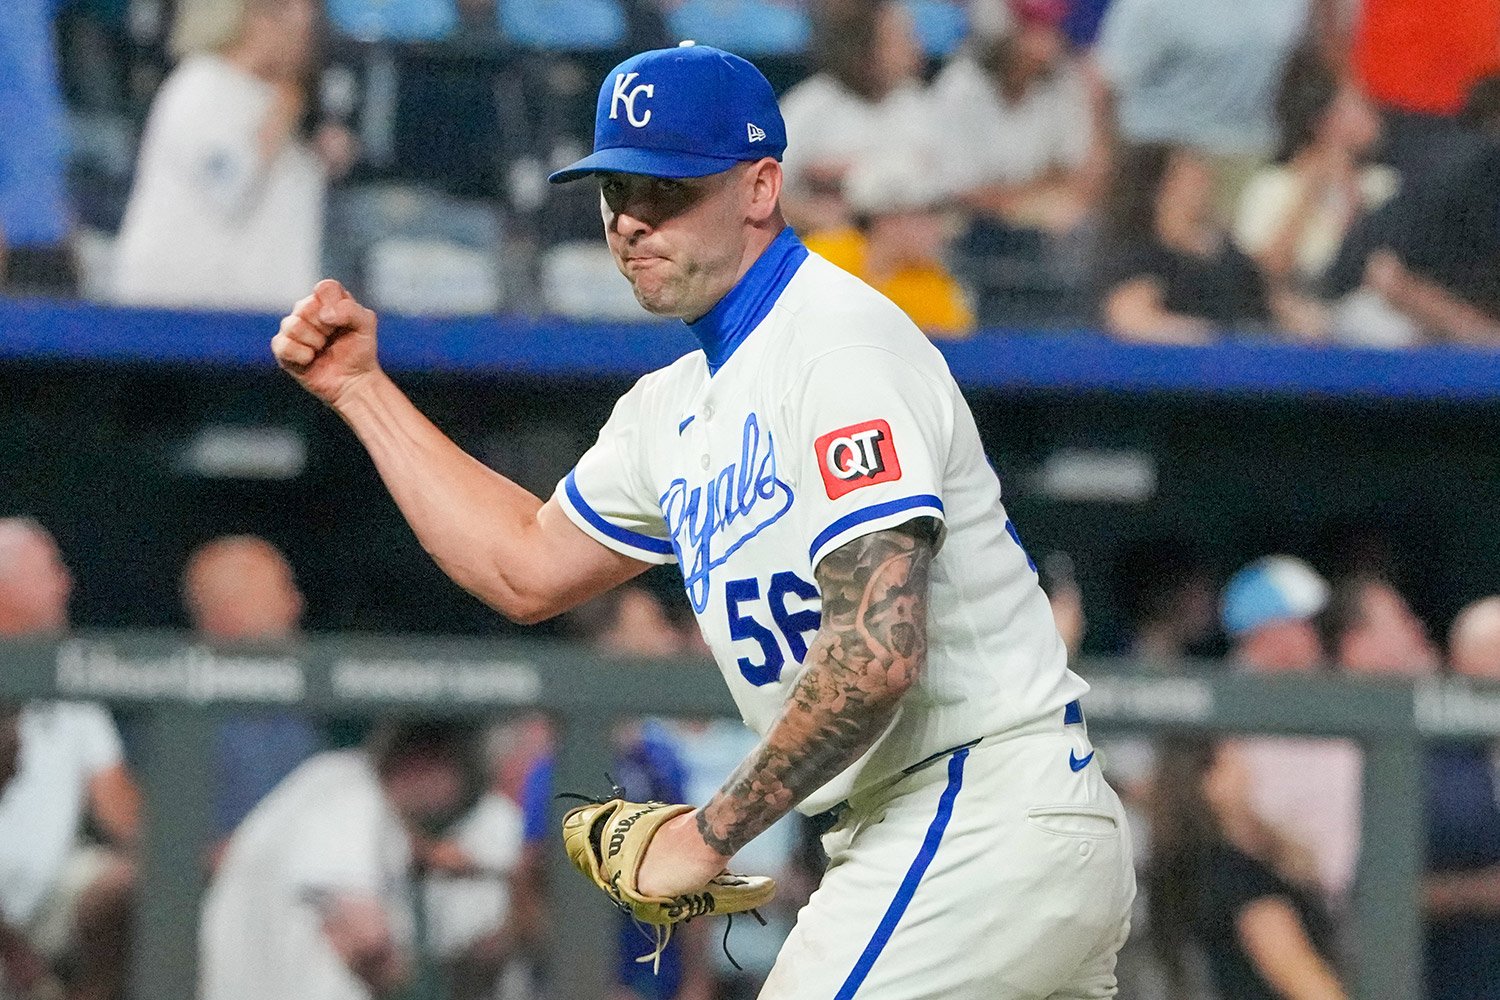 Let’s get this much straight: Alex Lange owns a 1-6 record and a 6.33 ERA across 42 ⅔ innings. It is exactly the kind of stat line that gets filed away as a decline after about two seconds of evaluation. But in Lange’s case, the ERA is telling an incomplete story: in save opportunities, he has posted a solid 3.75 ERA over 12 innings; outside of those situations, that number jumps to an ugly 7.34 across 30 ⅔ innings. Opposing hitters are batting just .198 against him from the eighth through ninth innings, but in every other situation, they are hitting .355. The leverage table explains that gap much better than the save column: Leverage Index BB% K-BB% HR/9 FIP xFIP Low Leverage 13.5% 9.6% 0.00 3.24 4.64 Medium Leverage 12.2% 8.2% 3.60 8.11 4.75 High Leverage 10.0% 15.0% 0.00 2.88 4.83 His walk rate steadily declines from 13.5% to 10.0% as the situation becomes more demanding, while his strikeout-minus-walk rate (K-BB%) reaches its highest point of the season (15.0%) exactly when the game demands his best pitches. This is not a pitcher losing command in the ninth inning. It is a location problem that appears outside those highest-pressure moments. The spike in Lange’s FIP during medium-leverage situations (8.11, compared with 3.24 in low leverage and 2.88 in high leverage) comes from one specific factor: a sudden jump in home runs allowed, with a 3.60 HR/9 mark. When we turn to xFIP — the metric that normalizes home run rate — the illusion fades: 4.64, 4.75 and 4.83. The league is seeing a pitcher profile that looks much more similar across all three situations than the results suggest; the numbers are mostly reflecting where those damaging home runs happened to cluster. That is where the repertoire tells the story that innings alone cannot explain. His fastballs are responsible for most of his damaging contact: he is allowing exit velocities above 93 mph in the upper areas of the strike zone, exactly the type of location where mistakes with his fastball become the easiest to punish. Meanwhile, his slider (32.1% usage) and his new cutter (12.1%) have not allowed a single home run this season (0.0% HR/FB). This is not a mental breakdown halfway through a game; it is that when Lange’s fastballs miss, they miss up and over the middle of the plate, and those mistakes have been concentrated in medium-leverage situations. That is the most important part of the story: this increased vulnerability in the air is the direct cost of a repertoire transition. In 2022, when Lange was built around a devastating knuckle-curve that accounted for nearly half of his pitches, he generated ground balls on 55.6% of balls in play. After eliminating the curveball completely beginning in 2023, his ground-ball rate has fallen to 42.9%. Lange went from being a pitcher who survived by keeping the ball on the ground to one who now relies more on hitters missing. That approach can work, but it comes with a smaller margin for error when mistakes start traveling in the air. With Kansas City controlling him through arbitration until the 2027 season, the question for the front office is not the surface-level appearance of a 6.33 ERA. It is whether Alex Lange has stopped being effective or whether he has simply become a different pitcher, with a different set of strengths and risks than the one who made him valuable in the first place. Everything points toward the latter: his command improves when the pressure rises, his most damaging contact is concentrated in two identifiable pitches, and his xFIP suggests a much more stable underlying profile. The solution for Matt Quatraro and his coaching staff is not to lose faith in Lange in the ninth inning. It is to understand when his fastball is being exposed and avoid putting him in those middle-inning situations where one misplaced pitch can change the game in a single swing.
-
Image courtesy of IMAGN IMAGES via Reuters Connect Let’s get this much straight: Alex Lange owns a 1-6 record and a 6.33 ERA across 42 ⅔ innings. It is exactly the kind of stat line that gets filed away as a decline after about two seconds of evaluation. But in Lange’s case, the ERA is telling an incomplete story: in save opportunities, he has posted a solid 3.75 ERA over 12 innings; outside of those situations, that number jumps to an ugly 7.34 across 30 ⅔ innings. Opposing hitters are batting just .198 against him from the eighth through ninth innings, but in every other situation, they are hitting .355. The leverage table explains that gap much better than the save column: Leverage Index BB% K-BB% HR/9 FIP xFIP Low Leverage 13.5% 9.6% 0.00 3.24 4.64 Medium Leverage 12.2% 8.2% 3.60 8.11 4.75 High Leverage 10.0% 15.0% 0.00 2.88 4.83 His walk rate steadily declines from 13.5% to 10.0% as the situation becomes more demanding, while his strikeout-minus-walk rate (K-BB%) reaches its highest point of the season (15.0%) exactly when the game demands his best pitches. This is not a pitcher losing command in the ninth inning. It is a location problem that appears outside those highest-pressure moments. The spike in Lange’s FIP during medium-leverage situations (8.11, compared with 3.24 in low leverage and 2.88 in high leverage) comes from one specific factor: a sudden jump in home runs allowed, with a 3.60 HR/9 mark. When we turn to xFIP — the metric that normalizes home run rate — the illusion fades: 4.64, 4.75 and 4.83. The league is seeing a pitcher profile that looks much more similar across all three situations than the results suggest; the numbers are mostly reflecting where those damaging home runs happened to cluster. That is where the repertoire tells the story that innings alone cannot explain. His fastballs are responsible for most of his damaging contact: he is allowing exit velocities above 93 mph in the upper areas of the strike zone, exactly the type of location where mistakes with his fastball become the easiest to punish. Meanwhile, his slider (32.1% usage) and his new cutter (12.1%) have not allowed a single home run this season (0.0% HR/FB). This is not a mental breakdown halfway through a game; it is that when Lange’s fastballs miss, they miss up and over the middle of the plate, and those mistakes have been concentrated in medium-leverage situations. That is the most important part of the story: this increased vulnerability in the air is the direct cost of a repertoire transition. In 2022, when Lange was built around a devastating knuckle-curve that accounted for nearly half of his pitches, he generated ground balls on 55.6% of balls in play. After eliminating the curveball completely beginning in 2023, his ground-ball rate has fallen to 42.9%. Lange went from being a pitcher who survived by keeping the ball on the ground to one who now relies more on hitters missing. That approach can work, but it comes with a smaller margin for error when mistakes start traveling in the air. With Kansas City controlling him through arbitration until the 2027 season, the question for the front office is not the surface-level appearance of a 6.33 ERA. It is whether Alex Lange has stopped being effective or whether he has simply become a different pitcher, with a different set of strengths and risks than the one who made him valuable in the first place. Everything points toward the latter: his command improves when the pressure rises, his most damaging contact is concentrated in two identifiable pitches, and his xFIP suggests a much more stable underlying profile. The solution for Matt Quatraro and his coaching staff is not to lose faith in Lange in the ninth inning. It is to understand when his fastball is being exposed and avoid putting him in those middle-inning situations where one misplaced pitch can change the game in a single swing. View full article
-
The Invisible Problem Behind Luinder Avila’s Collapse
Yirsandy Rodríguez posted an article in Royals
 Luinder Avila still looks like a pitcher who should be difficult to hit. His four-seam fastball remains around 96 mph, his sinker still carries the life that made his arsenal so dangerous, and opposing hitters are still struggling to generate quality contact against him. And yet, the results have changed dramatically. The reason is not that Ávila lost his stuff. His problem is that his stuff stopped controlling the at-bat the way it once did. The Royals right-hander has lost something far less obvious than velocity or movement: the ability to dictate what hitters do. His pitches remain effective individually, but they no longer function as a sequence that forces opponents to defend multiple possibilities from the first pitch. That distinction explains why a pitcher with nearly the same physical tools has become a much more vulnerable version of himself. Metric 2025 2026 Location+ 100 91 Chase% Percentile 75 19 Whiff% Percentile 85 40 BB% Percentile 62 6 The velocity never disappeared. His four-seam fastball is still sitting around 96 mph, and his sinker has actually shown slightly higher velocity than it did during his major league debut. His Stuff+ barely moved, declining from 104 to 100, a difference too small to explain the gap between the dominant pitcher of 2025 and the inconsistent version of 2026. The contact profile tells the same story. Ávila remains in the 77th percentile in Hard-Hit% and the 74th percentile in Barrel%, showing that hitters still are not consistently squaring him up. His pitches continue to limit the type of contact that usually changes games. The problem appears before contact ever happens. It begins with whether Ávila is controlling the count. In the five starts where he threw a first-pitch strike to at least 60% of hitters, the Royals are 5-0, and Ávila owns a 3.12 ERA. In the five starts where he failed to reach that mark, his ERA jumps to 8.68. That split reveals the foundation of the issue. When Ávila gets ahead early, his arsenal works the way it was designed to work. Hitters cannot eliminate pitches from their preparation because every option remains in play. The fastball creates hesitation. The sinker changes the eye level. The breaking ball becomes a weapon that arrives after the hitter has already been forced to defend too much. But when Ávila falls behind, the entire structure changes. Plate appearances become longer, hitters become more patient, and instead of forcing decisions, Ávila is forced to react to them. The first sign appears in his Chase%. In 2025, he ranked in the 75th percentile. Hitters chased pitches outside the strike zone because his sequencing created enough pressure to make them uncomfortable. In 2026, that number has collapsed to the 19th percentile. Opponents are no longer chasing. They are controlling the at-bat. That change naturally impacts his ability to miss bats. Ávila’s Whiff% has fallen from the 85th percentile to the 40th. With fewer swings and misses, he is reaching deeper counts and needing more precise execution to finish hitters. That has created the next problem: walks. His BB% has dropped from the 62nd percentile to the 6th percentile, suggesting that he is spending more time trying to recover advantages he previously created from the beginning of the plate appearance. No pitch better illustrates that transformation than his curveball. In 2025, the pitch was a true finishing weapon. It generated a 54.2% strikeout rate, a 20.8% SwStr%, and limited hitters to a .111 average. It was not simply a good pitch. It was the pitch that became devastating because everything before it had already forced hitters to protect against too many possibilities. In 2026, the curveball has almost disappeared from his attack plan. Its usage has dropped from 32.7% to 15.2%, and the results have changed completely. Hitters are producing a .550 xSLG against the pitch, the highest mark allowed by Ávila among all of his offerings. The same deterioration appears in the wOBA allowed against the curveball. 2025 2026 The sample size in 2026 is now more than double what Ávila produced during his debut season, making it harder to dismiss this as a temporary adjustment. But the decline is not simply a product of more exposure. The curveball itself has changed. It has lost five inches of horizontal break toward the glove side and 3.1 inches of vertical drop, turning it into a more recognizable pitch for hitters. But even that does not fully explain the regression; a slightly worse breaking ball can still be effective when it is thrown from an advantageous position. The problem is that Ávila is now reaching that pitch in counts where hitters already have control of the confrontation. That difference changes the way his 2026 season should be evaluated. For much of the year, Ávila’s regression has looked like the story of a pitcher who lost his weapons. The data suggests something different. The velocity remains. The ability to limit hard contact remains. The foundation of the arsenal that fueled his breakout is still there. What disappeared was the advantage that made every pitch influence the next decision. That matters because the diagnosis is different. A pitcher who loses velocity or movement usually needs to rebuild his repertoire. A pitcher who keeps his tools but loses control of the at-bat is dealing with a problem of execution, sequencing, and pitch usage. Ávila’s decline did not begin when his pitches stopped being good. It began when those pitches stopped forcing hitters to play under his conditions.
-
Image courtesy of IMAGN IMAGES via Reuters Connect Luinder Avila still looks like a pitcher who should be difficult to hit. His four-seam fastball remains around 96 mph, his sinker still carries the life that made his arsenal so dangerous, and opposing hitters are still struggling to generate quality contact against him. And yet, the results have changed dramatically. The reason is not that Ávila lost his stuff. His problem is that his stuff stopped controlling the at-bat the way it once did. The Royals right-hander has lost something far less obvious than velocity or movement: the ability to dictate what hitters do. His pitches remain effective individually, but they no longer function as a sequence that forces opponents to defend multiple possibilities from the first pitch. That distinction explains why a pitcher with nearly the same physical tools has become a much more vulnerable version of himself. Metric 2025 2026 Location+ 100 91 Chase% Percentile 75 19 Whiff% Percentile 85 40 BB% Percentile 62 6 The velocity never disappeared. His four-seam fastball is still sitting around 96 mph, and his sinker has actually shown slightly higher velocity than it did during his major league debut. His Stuff+ barely moved, declining from 104 to 100, a difference too small to explain the gap between the dominant pitcher of 2025 and the inconsistent version of 2026. The contact profile tells the same story. Ávila remains in the 77th percentile in Hard-Hit% and the 74th percentile in Barrel%, showing that hitters still are not consistently squaring him up. His pitches continue to limit the type of contact that usually changes games. The problem appears before contact ever happens. It begins with whether Ávila is controlling the count. In the five starts where he threw a first-pitch strike to at least 60% of hitters, the Royals are 5-0, and Ávila owns a 3.12 ERA. In the five starts where he failed to reach that mark, his ERA jumps to 8.68. That split reveals the foundation of the issue. When Ávila gets ahead early, his arsenal works the way it was designed to work. Hitters cannot eliminate pitches from their preparation because every option remains in play. The fastball creates hesitation. The sinker changes the eye level. The breaking ball becomes a weapon that arrives after the hitter has already been forced to defend too much. But when Ávila falls behind, the entire structure changes. Plate appearances become longer, hitters become more patient, and instead of forcing decisions, Ávila is forced to react to them. The first sign appears in his Chase%. In 2025, he ranked in the 75th percentile. Hitters chased pitches outside the strike zone because his sequencing created enough pressure to make them uncomfortable. In 2026, that number has collapsed to the 19th percentile. Opponents are no longer chasing. They are controlling the at-bat. That change naturally impacts his ability to miss bats. Ávila’s Whiff% has fallen from the 85th percentile to the 40th. With fewer swings and misses, he is reaching deeper counts and needing more precise execution to finish hitters. That has created the next problem: walks. His BB% has dropped from the 62nd percentile to the 6th percentile, suggesting that he is spending more time trying to recover advantages he previously created from the beginning of the plate appearance. No pitch better illustrates that transformation than his curveball. In 2025, the pitch was a true finishing weapon. It generated a 54.2% strikeout rate, a 20.8% SwStr%, and limited hitters to a .111 average. It was not simply a good pitch. It was the pitch that became devastating because everything before it had already forced hitters to protect against too many possibilities. In 2026, the curveball has almost disappeared from his attack plan. Its usage has dropped from 32.7% to 15.2%, and the results have changed completely. Hitters are producing a .550 xSLG against the pitch, the highest mark allowed by Ávila among all of his offerings. The same deterioration appears in the wOBA allowed against the curveball. 2025 2026 The sample size in 2026 is now more than double what Ávila produced during his debut season, making it harder to dismiss this as a temporary adjustment. But the decline is not simply a product of more exposure. The curveball itself has changed. It has lost five inches of horizontal break toward the glove side and 3.1 inches of vertical drop, turning it into a more recognizable pitch for hitters. But even that does not fully explain the regression; a slightly worse breaking ball can still be effective when it is thrown from an advantageous position. The problem is that Ávila is now reaching that pitch in counts where hitters already have control of the confrontation. That difference changes the way his 2026 season should be evaluated. For much of the year, Ávila’s regression has looked like the story of a pitcher who lost his weapons. The data suggests something different. The velocity remains. The ability to limit hard contact remains. The foundation of the arsenal that fueled his breakout is still there. What disappeared was the advantage that made every pitch influence the next decision. That matters because the diagnosis is different. A pitcher who loses velocity or movement usually needs to rebuild his repertoire. A pitcher who keeps his tools but loses control of the at-bat is dealing with a problem of execution, sequencing, and pitch usage. Ávila’s decline did not begin when his pitches stopped being good. It began when those pitches stopped forcing hitters to play under his conditions. View full article
-
Image courtesy of © Jay Biggerstaff-Imagn Images Stephen Kolek owns one of the lowest strikeout rates among Kansas City starters. His K% sits at 9.9 against lefties and 10.0 against righties, second-worst in the rotation in both splits. Yet his slider still generates whiffs at a level comparable to some of the best relievers in the league. In 2026, it has produced a 42.7% whiff rate and a 34.1% strikeout rate. Isolated, it belongs in a different profile. A pitch mix is not a collection of stuff but a sequence in which each pitch gives meaning to the next. In 2025, Kolek's sinker and changeup provided that structure. Neither dominated, but both shaped at-bats. The sinker generated ground balls (64.7% GB), while the changeup neutralized lefties (.049 AVG, 26.2% K). Together, they forced hitters to cover the lower half of the zone, opening lanes for the four-seam and slider. In 2026, that foundation is gone. Both pitches have lost their ability to alter swing decisions. The changeup no longer punishes zone contact, and the sinker no longer consistently drives the ball into the ground. Pitch Type Chase% 2025 Chase% 2026 BA 2025 BA 2026 Sinker 24.7% 22.2% .267 .304 Changeup 32.3% 29.6% .049 .310 Without that base, the rest of the arsenal flattens. The four-seam fastball is no longer protected vertically; its ground-ball rate drops from 47.2% to 30.3%, while usage rises to 27.7%. Hitters no longer need to respect the bottom of the zone. Pitch Type Usage 2025 Usage 2026 Whiff% 2026 K% 2026 Sinker 24.1% 22.0% 6 6.6 Changeup 11.6% 12.5% 18.4 16.1 4-Seam 25.6% 27.7% 18.1 7.5 Slider 23.4% 16.8% 42.7 34.1 The slider remains the only elite pitch in the mix. But it no longer shapes at-bats because the pitches surrounding it aren't fooling batters. The slider's usage has declined, and its role as a finishing weapon has lessened. Kolek's start against Tampa Bay made it visible. Three runs in the second inning, 42 pitches to escape it. The problem was not execution, but duration. No at-bat was forced into early commitment. The results by times through the order confirm the pattern: TTO FIP AVG SLG HardHit% 1st Time 3.82 .250 .408 34.9 2nd Time 4.51 .243 .392 23.0 3rd Time 6.11 .298 .574 46.2 Each pass through the lineup strips another layer of flexibility. By the third time, hitters are no longer predicting a sequence; they are attacking isolated pitches. Without sinker or changeup-shaped counts, the four-seam becomes predictable, and the slider becomes detached. The mix stops functioning, weakening all of Kolek's offerings. In the end, the data does not describe a decline in stuff. It describes a pitch mix that no longer forces decisions. And when that happens, the outcome is already simplified before the pitch is thrown. Kolek still has a dominant weapon, but he no longer has a working system. View full article
-
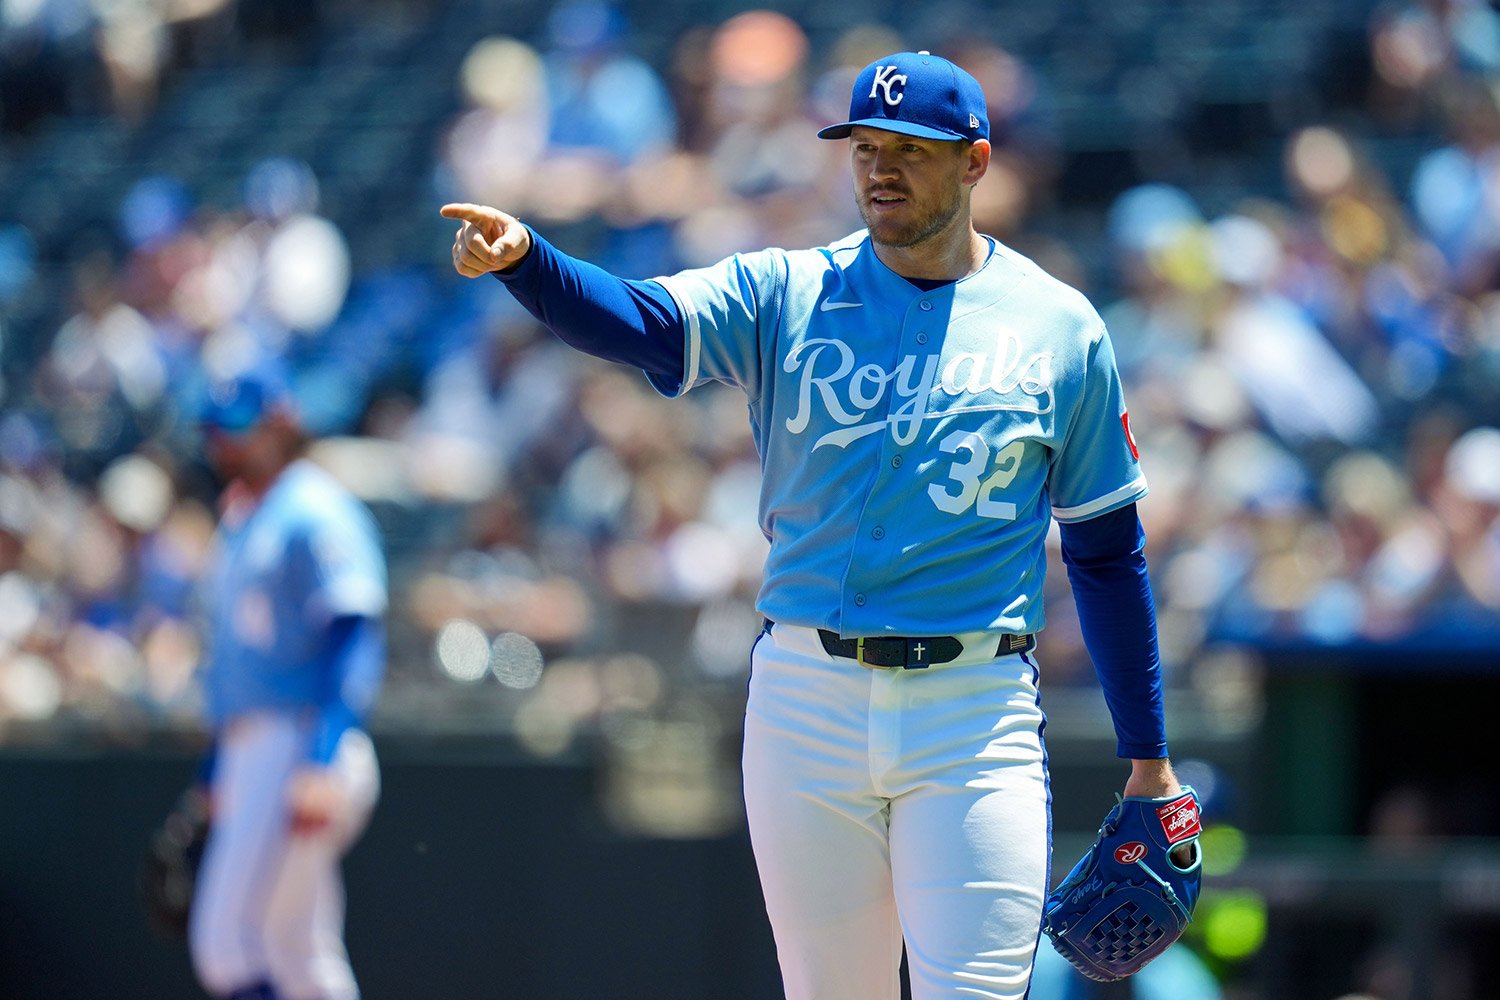 Stephen Kolek owns one of the lowest strikeout rates among Kansas City starters. His K% sits at 9.9 against lefties and 10.0 against righties, second-worst in the rotation in both splits. Yet his slider still generates whiffs at a level comparable to some of the best relievers in the league. In 2026, it has produced a 42.7% whiff rate and a 34.1% strikeout rate. Isolated, it belongs in a different profile. A pitch mix is not a collection of stuff but a sequence in which each pitch gives meaning to the next. In 2025, Kolek's sinker and changeup provided that structure. Neither dominated, but both shaped at-bats. The sinker generated ground balls (64.7% GB), while the changeup neutralized lefties (.049 AVG, 26.2% K). Together, they forced hitters to cover the lower half of the zone, opening lanes for the four-seam and slider. In 2026, that foundation is gone. Both pitches have lost their ability to alter swing decisions. The changeup no longer punishes zone contact, and the sinker no longer consistently drives the ball into the ground. Pitch Type Chase% 2025 Chase% 2026 BA 2025 BA 2026 Sinker 24.7% 22.2% .267 .304 Changeup 32.3% 29.6% .049 .310 Without that base, the rest of the arsenal flattens. The four-seam fastball is no longer protected vertically; its ground-ball rate drops from 47.2% to 30.3%, while usage rises to 27.7%. Hitters no longer need to respect the bottom of the zone. Pitch Type Usage 2025 Usage 2026 Whiff% 2026 K% 2026 Sinker 24.1% 22.0% 6 6.6 Changeup 11.6% 12.5% 18.4 16.1 4-Seam 25.6% 27.7% 18.1 7.5 Slider 23.4% 16.8% 42.7 34.1 The slider remains the only elite pitch in the mix. But it no longer shapes at-bats because the pitches surrounding it aren't fooling batters. The slider's usage has declined, and its role as a finishing weapon has lessened. Kolek's start against Tampa Bay made it visible. Three runs in the second inning, 42 pitches to escape it. The problem was not execution, but duration. No at-bat was forced into early commitment. The results by times through the order confirm the pattern: TTO FIP AVG SLG HardHit% 1st Time 3.82 .250 .408 34.9 2nd Time 4.51 .243 .392 23.0 3rd Time 6.11 .298 .574 46.2 Each pass through the lineup strips another layer of flexibility. By the third time, hitters are no longer predicting a sequence; they are attacking isolated pitches. Without sinker or changeup-shaped counts, the four-seam becomes predictable, and the slider becomes detached. The mix stops functioning, weakening all of Kolek's offerings. In the end, the data does not describe a decline in stuff. It describes a pitch mix that no longer forces decisions. And when that happens, the outcome is already simplified before the pitch is thrown. Kolek still has a dominant weapon, but he no longer has a working system.
-
Image courtesy of © Jay Biggerstaff-Imagn Images Noah Cameron has a problem, and it isn't his curveball. It's everything around it. His curve remains one of the five most effective breaking pitches in baseball, but it has become the only pitch in his arsenal that hitters still have to respect. Over the past two seasons, Cameron's curveball has struck out 40.1% of the hitters who have faced it while allowing just a .165 batting average, a .224 slugging percentage, and a .210 wOBA. It has performed at the same level as Ranger Suárez's and Joey Cantillo's. It's the kind of pitch any starter would want as the foundation of his repertoire. It's also the only pitch in his arsenal that has maintained that level of performance. That has changed the way hitters attack him. In 2025, hitters chased 32.2% of Cameron's curveballs thrown outside the strike zone. The pitch generated a 37.4% whiff rate and produced a Run Value of +2.7 per 100 pitches. In 2026, those numbers have moved in the opposite direction. His O-Swing rate has fallen to 25.7%, the whiff rate has dropped to 29.5%, and the pitch now carries a Run Value of -0.3 per 100 pitches. Metric 2025 2026 Change O-Swing% 32.20% 25.70% -6.5 pp Whiff% 37.40% 29.50% -7.9 pp Run Value/100 2.7 -0.3 -3 The pitch itself has barely changed. Its velocity, vertical movement, and spin profile have remained almost identical. What changed was the hitters’ response. They’re no longer chasing it at the same rate. One plausible explanation is that the rest of Cameron’s arsenal no longer poses enough of a threat to force hitters to protect the zone early in the count. The rest of his arsenal supports that theory. None of his other pitches has complemented the curveball with any consistency. His four-seam fastball has allowed a 49.3% HardHit rate and a .280 batting average. The cutter hasn’t provided a reliable alternative either, surrendering a .338 average, while both the slider and sinker have been hit even harder. Combined, those four pitches account for 61.5% of Cameron’s repertoire, compared to just 16.8% for his curveball. The results suggest hitters can afford to wait for something more hittable instead of protecting against his best pitch. His pitch usage by count tells the same story. When ahead, Cameron throws his curveball 7.1% of the time and allows just a .084 batting average against it. That’s exactly the type of pitch a starter wants to finish an at-bat. When he falls behind, however, the curveball nearly disappears, dropping to just 2.3% usage, while his repertoire shifts toward fastballs, against which opponents are batting .329. Situation AVG vs. Curveball AVG vs. Fastballs Pitcher Ahead .084 .167 Pitcher Behind .211 .329 That split is unlikely to be a coincidence. It illustrates how Cameron's pitch mix changes once he loses control of the count. The issue isn't that he relies too little on the curveball when ahead—it remains dominant in those situations. The challenge comes when he has to lean on the rest of his arsenal to regain leverage in the count. At the same time, Cameron has improved in several important areas. His strikeout rate has climbed from the 55th percentile to the 82nd, while his walk rate has improved from the 33rd to the 75th. He's commanding the strike zone more effectively and generating more swings and misses overall. The quality of contact, however, has moved sharply in the opposite direction. His Hard Hit percentile has fallen from the 82nd to the 48th, his Barrel percentile from the 73rd to the 24th, and the Run Value of his breaking pitches from the 99th to the 21st. Hitters aren't just making more contact; they're doing far more damage when they connect. The lack of a reliable second pitch helps explain that pattern. The slider is the clearest example. In 2025, it held hitters to a .205 batting average and a .256 slugging percentage while generating a 31.1% whiff rate. One year later, those numbers have climbed to .300 and .550, prompting Cameron to reduce its usage from 14.1% to 9.6%. The sinker hasn't offered an answer either, allowing a .636 batting average. His changeup, meanwhile, has been his second-most effective pitch, producing just a 24.1% HardHit rate, and it may represent his best option for bringing more balance to the repertoire. Noah Cameron's curveball has never stopped being an elite pitch. What has changed is everything around it. Until the rest of his repertoire forces hitters to respect more than one weapon, his curveball will continue carrying a burden no single pitch can shoulder on its own. View full article
-
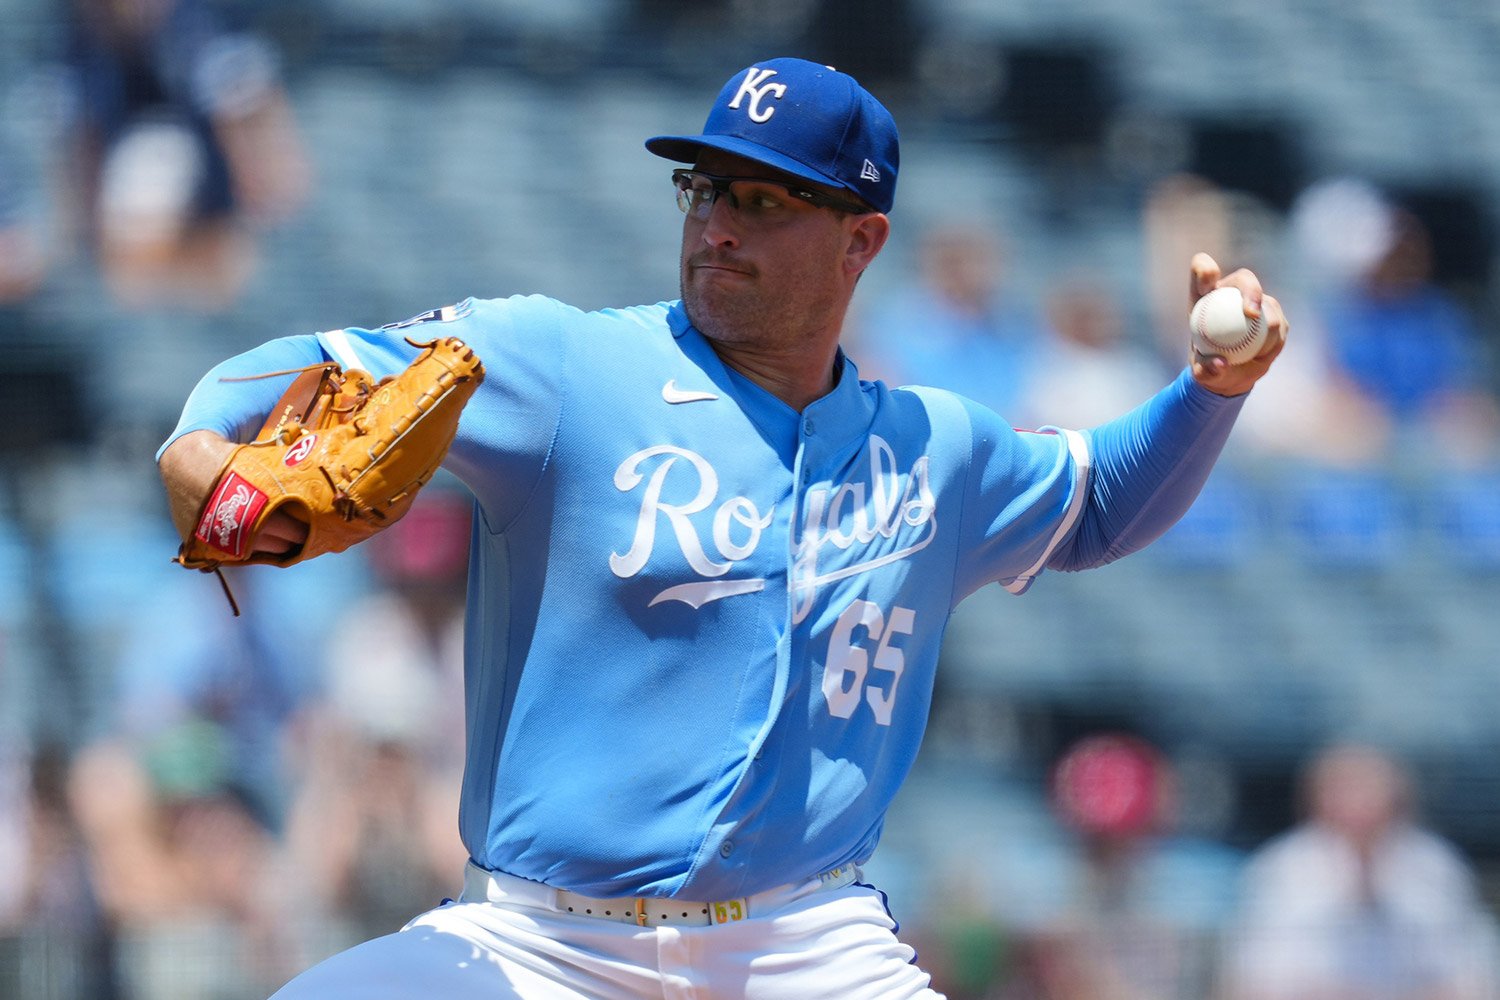 Noah Cameron has a problem, and it isn't his curveball. It's everything around it. His curve remains one of the five most effective breaking pitches in baseball, but it has become the only pitch in his arsenal that hitters still have to respect. Over the past two seasons, Cameron's curveball has struck out 40.1% of the hitters who have faced it while allowing just a .165 batting average, a .224 slugging percentage, and a .210 wOBA. It has performed at the same level as Ranger Suárez's and Joey Cantillo's. It's the kind of pitch any starter would want as the foundation of his repertoire. It's also the only pitch in his arsenal that has maintained that level of performance. That has changed the way hitters attack him. In 2025, hitters chased 32.2% of Cameron's curveballs thrown outside the strike zone. The pitch generated a 37.4% whiff rate and produced a Run Value of +2.7 per 100 pitches. In 2026, those numbers have moved in the opposite direction. His O-Swing rate has fallen to 25.7%, the whiff rate has dropped to 29.5%, and the pitch now carries a Run Value of -0.3 per 100 pitches. Metric 2025 2026 Change O-Swing% 32.20% 25.70% -6.5 pp Whiff% 37.40% 29.50% -7.9 pp Run Value/100 2.7 -0.3 -3 The pitch itself has barely changed. Its velocity, vertical movement, and spin profile have remained almost identical. What changed was the hitters’ response. They’re no longer chasing it at the same rate. One plausible explanation is that the rest of Cameron’s arsenal no longer poses enough of a threat to force hitters to protect the zone early in the count. The rest of his arsenal supports that theory. None of his other pitches has complemented the curveball with any consistency. His four-seam fastball has allowed a 49.3% HardHit rate and a .280 batting average. The cutter hasn’t provided a reliable alternative either, surrendering a .338 average, while both the slider and sinker have been hit even harder. Combined, those four pitches account for 61.5% of Cameron’s repertoire, compared to just 16.8% for his curveball. The results suggest hitters can afford to wait for something more hittable instead of protecting against his best pitch. His pitch usage by count tells the same story. When ahead, Cameron throws his curveball 7.1% of the time and allows just a .084 batting average against it. That’s exactly the type of pitch a starter wants to finish an at-bat. When he falls behind, however, the curveball nearly disappears, dropping to just 2.3% usage, while his repertoire shifts toward fastballs, against which opponents are batting .329. Situation AVG vs. Curveball AVG vs. Fastballs Pitcher Ahead .084 .167 Pitcher Behind .211 .329 That split is unlikely to be a coincidence. It illustrates how Cameron's pitch mix changes once he loses control of the count. The issue isn't that he relies too little on the curveball when ahead—it remains dominant in those situations. The challenge comes when he has to lean on the rest of his arsenal to regain leverage in the count. At the same time, Cameron has improved in several important areas. His strikeout rate has climbed from the 55th percentile to the 82nd, while his walk rate has improved from the 33rd to the 75th. He's commanding the strike zone more effectively and generating more swings and misses overall. The quality of contact, however, has moved sharply in the opposite direction. His Hard Hit percentile has fallen from the 82nd to the 48th, his Barrel percentile from the 73rd to the 24th, and the Run Value of his breaking pitches from the 99th to the 21st. Hitters aren't just making more contact; they're doing far more damage when they connect. The lack of a reliable second pitch helps explain that pattern. The slider is the clearest example. In 2025, it held hitters to a .205 batting average and a .256 slugging percentage while generating a 31.1% whiff rate. One year later, those numbers have climbed to .300 and .550, prompting Cameron to reduce its usage from 14.1% to 9.6%. The sinker hasn't offered an answer either, allowing a .636 batting average. His changeup, meanwhile, has been his second-most effective pitch, producing just a 24.1% HardHit rate, and it may represent his best option for bringing more balance to the repertoire. Noah Cameron's curveball has never stopped being an elite pitch. What has changed is everything around it. Until the rest of his repertoire forces hitters to respect more than one weapon, his curveball will continue carrying a burden no single pitch can shoulder on its own.
-
Image courtesy of © Peter Aiken-Imagn Images When the Royals signed Lane Thomas, they weren't looking for a superstar. They wanted a dependable two-way outfielder, the player who hit 28 home runs, stole 20 bases, and posted a 109 wRC+ with the Nationals just two seasons earlier at age 27. That version of Thomas has yet to show up in Kansas City. Season Team AVG OBP SLG OPS ISO HR SB wRC+ 2023 WSN .268 .315 .468 .783 .201 28 20 109 2026 KCR .217 .327 .339 .666 .122 5 4 89 His .217/.327/.339 slash line and 89 wRC+ tell the story of an offense that has fallen well short of expectations. Injuries explain part of it. Between 2024 and 2025, Thomas dealt with a left MCL sprain, a bone bruise fracture in his right wrist, and plantar fasciitis that eventually required surgery. The numbers, however, suggest the root of his disappointing season goes well beyond time spent on the injured list. At first glance, several indicators point in the right direction. Thomas has never walked more often, posting a career-high 13.5% walk rate compared to his 8.5% career average. He's also cut his strikeout rate to 22.0%—the second-lowest mark of his career—and is chasing pitches outside the strike zone less than at any previous point in his career. Metric 2023 (WSN) 2024 2025 2026 (KCR) BB% 5.3% 8.3% 9.9% 13.5% K% 25.8% 25.9% 31.0% 22.0% That's usually the profile of a hitter with better pitch recognition, improved swing decisions, and more favorable counts. More often than not, that process leads to better offensive production. For Thomas, the opposite has happened. That raises a more interesting question: How can a hitter make better decisions at the plate while becoming less dangerous? That contradiction defines his 2026 season. The biggest drop comes once he makes contact. Power Metric 2023 (WSN) 2024 2025 2026 (KCR) ISO 20.1% 16.3% 11.2% 12.2% Barrel% 9.6% 7.4% 4.8% 4.2% HR/FB% 16.4% 10.9% 9.3% 8.2% His .122 ISO is the second-lowest of his career, while his .339 slugging percentage sits well below the levels he reached during his best seasons. Even more concerning, his 4.2% barrel rate is a career low, and only 8.2% of his fly balls have left the yard. Thomas is earning better counts and wasting fewer plate appearances, but he no longer turns those advantages into impactful contact. The injuries may have contributed to that change, especially after the issues involving his knee, wrist, and foot. The metrics now point somewhere else: the way he's generating contact. His 72.1 mph bat speed remains above the MLB average, yet his ability to produce optimal launch angles has declined for three straight seasons, with his Blast Rate dropping from 15.3% in 2024 to 10.2% in 2026. Statcast tells the same story. His Square-Up rate has improved from 2025 but remains well below the level he reached during his best offensive years. His .263 BABIP and .239 xBA also leave little room to blame bad luck. Thomas is still recognizing pitches. He just isn't producing the kind of contact that consistently turns into extra-base hits. The problems don't end at the plate. Thomas has also become a defensive liability, posting a -5 Outs Above Average and -2.1 defensive value in just 71 games. Even center field, once his best position, has slipped to -2 OAA. The diagnosis is clear. But is there a path back? If Thomas is going to rediscover the player who hit 28 home runs in 2023, he'll need to rebuild his swing mechanics. His 72.1 mph bat speed is virtually unchanged from that season's 71.8 mph, but his Tilt has dropped from 29 degrees to 27 degrees, his Swing Path has flattened, and his Blast Rate has fallen from 16.2% to 10.2%. The issue isn't strength or pitch recognition. It's a swing that no longer creates the attack angle needed to turn good swing decisions into power. Lane Thomas hasn't lost his ability to recognize pitches or the bat speed needed to remain a productive hitter. What he's lost is the swing that once turned good swing decisions into damage. Until he regains that attack angle, the Royals will keep waiting for the player they thought they had acquired—a player who, for now, exists only in the memory of his 2023 season. View full article
-
What's Behind Lane Thomas' Disappointing Season With The Royals
Yirsandy Rodríguez posted an article in Royals
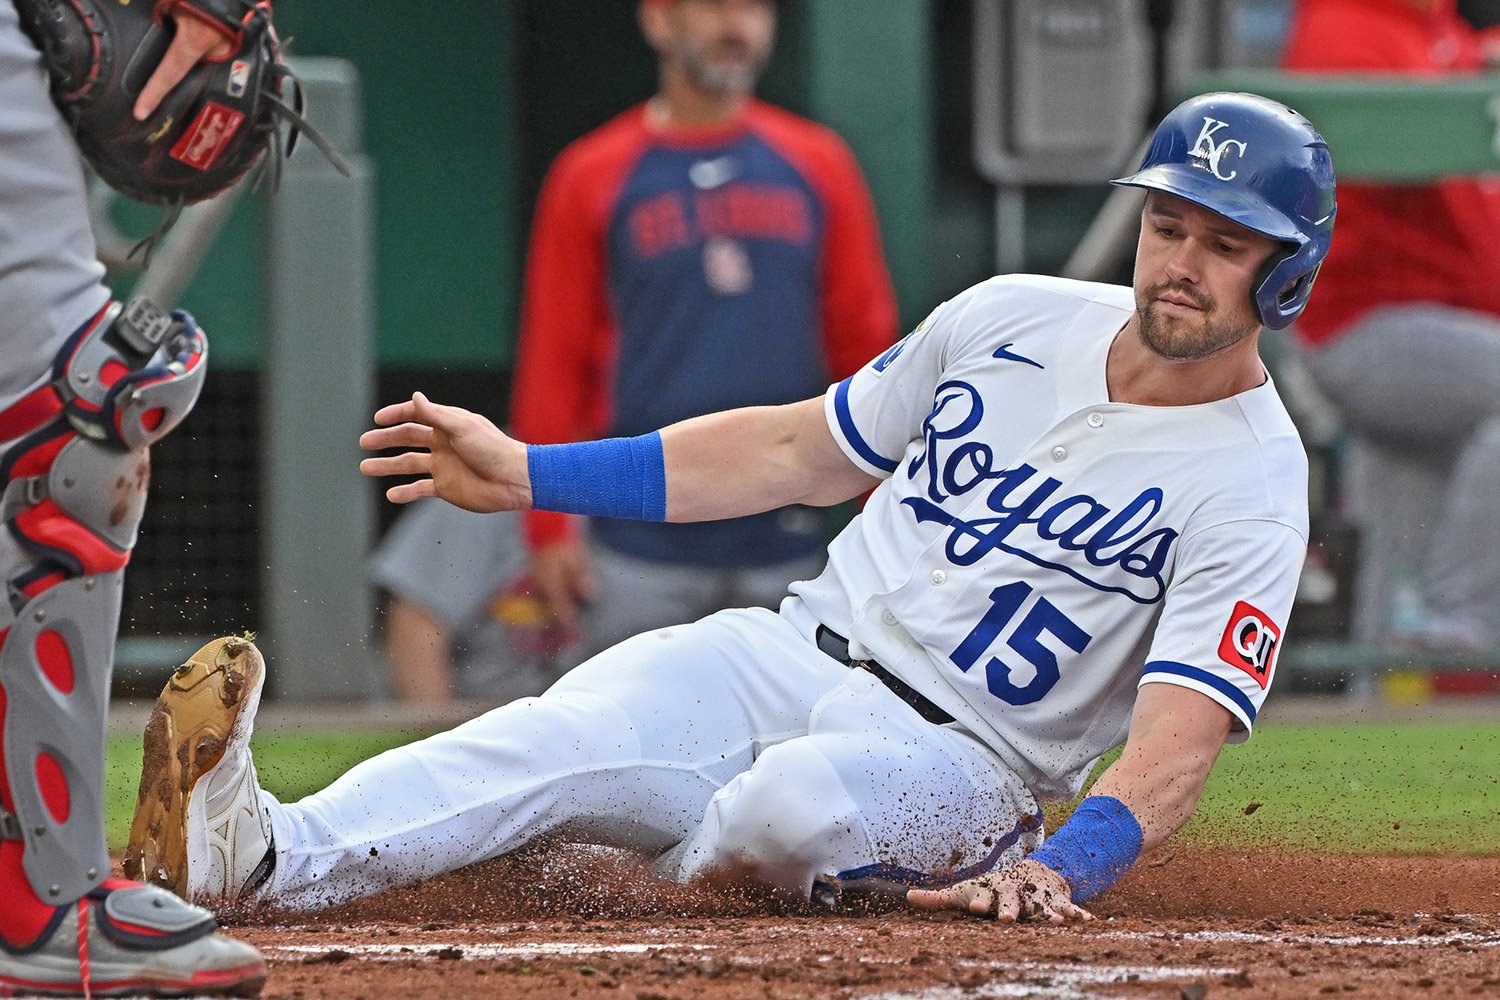 When the Royals signed Lane Thomas, they weren't looking for a superstar. They wanted a dependable two-way outfielder, the player who hit 28 home runs, stole 20 bases, and posted a 109 wRC+ with the Nationals just two seasons earlier at age 27. That version of Thomas has yet to show up in Kansas City. Season Team AVG OBP SLG OPS ISO HR SB wRC+ 2023 WSN .268 .315 .468 .783 .201 28 20 109 2026 KCR .217 .327 .339 .666 .122 5 4 89 His .217/.327/.339 slash line and 89 wRC+ tell the story of an offense that has fallen well short of expectations. Injuries explain part of it. Between 2024 and 2025, Thomas dealt with a left MCL sprain, a bone bruise fracture in his right wrist, and plantar fasciitis that eventually required surgery. The numbers, however, suggest the root of his disappointing season goes well beyond time spent on the injured list. At first glance, several indicators point in the right direction. Thomas has never walked more often, posting a career-high 13.5% walk rate compared to his 8.5% career average. He's also cut his strikeout rate to 22.0%—the second-lowest mark of his career—and is chasing pitches outside the strike zone less than at any previous point in his career. Metric 2023 (WSN) 2024 2025 2026 (KCR) BB% 5.3% 8.3% 9.9% 13.5% K% 25.8% 25.9% 31.0% 22.0% That's usually the profile of a hitter with better pitch recognition, improved swing decisions, and more favorable counts. More often than not, that process leads to better offensive production. For Thomas, the opposite has happened. That raises a more interesting question: How can a hitter make better decisions at the plate while becoming less dangerous? That contradiction defines his 2026 season. The biggest drop comes once he makes contact. Power Metric 2023 (WSN) 2024 2025 2026 (KCR) ISO 20.1% 16.3% 11.2% 12.2% Barrel% 9.6% 7.4% 4.8% 4.2% HR/FB% 16.4% 10.9% 9.3% 8.2% His .122 ISO is the second-lowest of his career, while his .339 slugging percentage sits well below the levels he reached during his best seasons. Even more concerning, his 4.2% barrel rate is a career low, and only 8.2% of his fly balls have left the yard. Thomas is earning better counts and wasting fewer plate appearances, but he no longer turns those advantages into impactful contact. The injuries may have contributed to that change, especially after the issues involving his knee, wrist, and foot. The metrics now point somewhere else: the way he's generating contact. His 72.1 mph bat speed remains above the MLB average, yet his ability to produce optimal launch angles has declined for three straight seasons, with his Blast Rate dropping from 15.3% in 2024 to 10.2% in 2026. Statcast tells the same story. His Square-Up rate has improved from 2025 but remains well below the level he reached during his best offensive years. His .263 BABIP and .239 xBA also leave little room to blame bad luck. Thomas is still recognizing pitches. He just isn't producing the kind of contact that consistently turns into extra-base hits. The problems don't end at the plate. Thomas has also become a defensive liability, posting a -5 Outs Above Average and -2.1 defensive value in just 71 games. Even center field, once his best position, has slipped to -2 OAA. The diagnosis is clear. But is there a path back? If Thomas is going to rediscover the player who hit 28 home runs in 2023, he'll need to rebuild his swing mechanics. His 72.1 mph bat speed is virtually unchanged from that season's 71.8 mph, but his Tilt has dropped from 29 degrees to 27 degrees, his Swing Path has flattened, and his Blast Rate has fallen from 16.2% to 10.2%. The issue isn't strength or pitch recognition. It's a swing that no longer creates the attack angle needed to turn good swing decisions into power. Lane Thomas hasn't lost his ability to recognize pitches or the bat speed needed to remain a productive hitter. What he's lost is the swing that once turned good swing decisions into damage. Until he regains that attack angle, the Royals will keep waiting for the player they thought they had acquired—a player who, for now, exists only in the memory of his 2023 season.
-
Image courtesy of © William Purnell-Imagn Images Carter Jensen's 16-game hitting streak isn't the story. The story is what happened before it. What changed for a hitter who endured one of his worst offensive months in May to suddenly own the longest active hitting streak in the majors? He answered the first adjustment major league pitchers made against him. Jensen spent April punishing fastballs, posting a .602 expected slugging percentage (xSLG) against them in 52 plate appearances. The league adjusted quickly. Rather than challenging him with velocity, pitchers shifted toward breaking balls and offspeed pitches, forcing him to prove he could produce once his best pitch disappeared. That approach worked in May. Breaking balls became the centerpiece of every game plan. Jensen hit just .116 against breaking balls and offspeed pitches combined, and 58% of his strikeouts came against those offerings. His production collapsed because pitchers dictated the terms of the at-bat instead of allowing him to attack pitches he handled best. The important question wasn't whether Jensen could snap out of a slump. It was a question of whether that weakness would become part of his long-term offensive profile. June has started to answer that question. Carter Jensen Performance vs. Breaking Balls Month AVG SLG Exit Velocity Whiff April .133 .133 87.4 mph 37.5% May .139 .194 87.0 mph 29.2% June .265 .529 94.8 mph 26.7% The numbers point to something more important than a higher batting average. Jensen is making more contact against breaking balls and hitting them much harder. His average exit velocity has jumped by nearly eight mph, while his whiff rate has continued to fall. The pitch that controlled his at-bats a month ago is no longer producing the same outcome. Pitchers haven’t abandoned their plan, either. They’re actually throwing Jensen more offspeed pitches than they did in May. He’s responded by cutting his whiff rate against those pitches from 42.1% to 14.3%. He’s also gone 3-for-11 against them this month, and every hit has gone for extra bases—two doubles and a home run. His average exit velocity has climbed from 75.5 mph to 96.6 mph over that span. The sample remains small, but the adjustment is visible. Jensen isn’t succeeding because pitchers have changed their approach. He’s succeeding because he changed his response. Jensen Monthly Offensive Production Month AVG SLG K% wRC+ Mar./Apr. .256 .478 29.1% 124 May .198 .309 28.3% 55 June .277 .518 21.7% 126 That adjustment reaches beyond his production against specific pitch types. Jensen's strikeout rate has dropped by nearly seven percentage points from May to June, a sign that he's losing fewer plate appearances against the pitches that exposed him earlier in the season. Those aren't independent trends. They're different outcomes of the same adjustment. Kansas City has responded, too. The Royals have hit Jensen near the top of the lineup throughout much of June. That's less about rewarding a hitting streak than recognizing better plate appearances. His .359 wOBA and .311 BABIP this month support what the underlying changes already suggest: he's making pitchers work under different conditions than he did just a few weeks ago. That's the value of this hitting streak. It doesn't prove Jensen has solved major league pitching. It doesn't guarantee the league won't find another weakness. It does suggest something every organization wants to see from a young hitter. When major league pitchers identified Jensen's first offensive vulnerability, he adjusted before it became part of his identity. The streak may end tomorrow. That adjustment is what Kansas City should remember. View full article
-
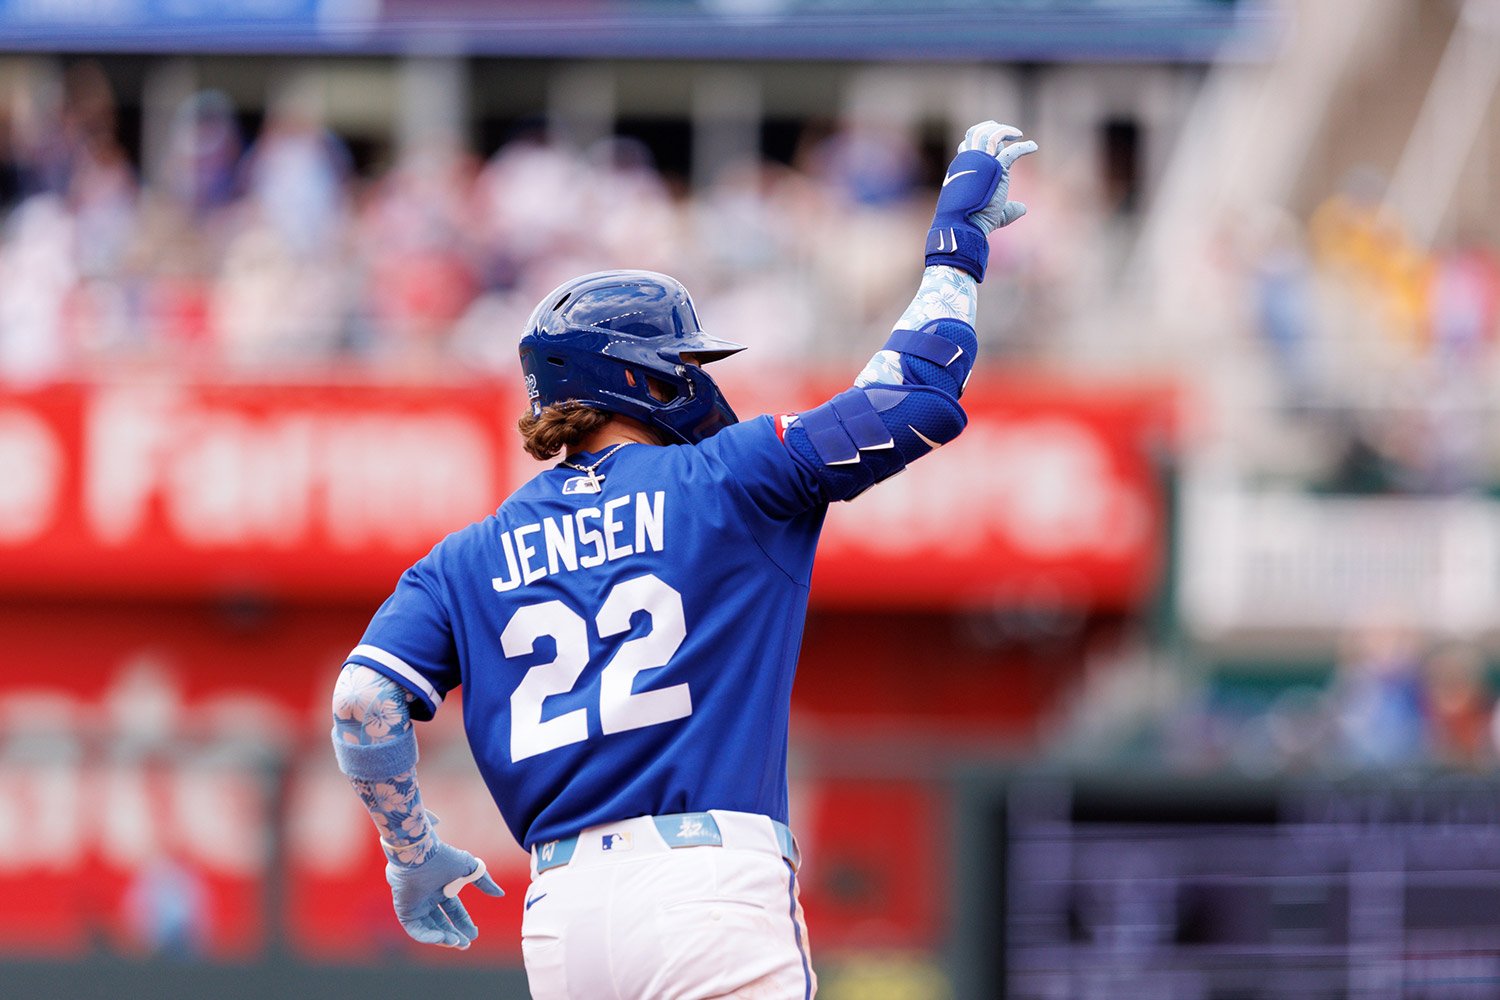 Carter Jensen's 16-game hitting streak isn't the story. The story is what happened before it. What changed for a hitter who endured one of his worst offensive months in May to suddenly own the longest active hitting streak in the majors? He answered the first adjustment major league pitchers made against him. Jensen spent April punishing fastballs, posting a .602 expected slugging percentage (xSLG) against them in 52 plate appearances. The league adjusted quickly. Rather than challenging him with velocity, pitchers shifted toward breaking balls and offspeed pitches, forcing him to prove he could produce once his best pitch disappeared. That approach worked in May. Breaking balls became the centerpiece of every game plan. Jensen hit just .116 against breaking balls and offspeed pitches combined, and 58% of his strikeouts came against those offerings. His production collapsed because pitchers dictated the terms of the at-bat instead of allowing him to attack pitches he handled best. The important question wasn't whether Jensen could snap out of a slump. It was a question of whether that weakness would become part of his long-term offensive profile. June has started to answer that question. Carter Jensen Performance vs. Breaking Balls Month AVG SLG Exit Velocity Whiff April .133 .133 87.4 mph 37.5% May .139 .194 87.0 mph 29.2% June .265 .529 94.8 mph 26.7% The numbers point to something more important than a higher batting average. Jensen is making more contact against breaking balls and hitting them much harder. His average exit velocity has jumped by nearly eight mph, while his whiff rate has continued to fall. The pitch that controlled his at-bats a month ago is no longer producing the same outcome. Pitchers haven’t abandoned their plan, either. They’re actually throwing Jensen more offspeed pitches than they did in May. He’s responded by cutting his whiff rate against those pitches from 42.1% to 14.3%. He’s also gone 3-for-11 against them this month, and every hit has gone for extra bases—two doubles and a home run. His average exit velocity has climbed from 75.5 mph to 96.6 mph over that span. The sample remains small, but the adjustment is visible. Jensen isn’t succeeding because pitchers have changed their approach. He’s succeeding because he changed his response. Jensen Monthly Offensive Production Month AVG SLG K% wRC+ Mar./Apr. .256 .478 29.1% 124 May .198 .309 28.3% 55 June .277 .518 21.7% 126 That adjustment reaches beyond his production against specific pitch types. Jensen's strikeout rate has dropped by nearly seven percentage points from May to June, a sign that he's losing fewer plate appearances against the pitches that exposed him earlier in the season. Those aren't independent trends. They're different outcomes of the same adjustment. Kansas City has responded, too. The Royals have hit Jensen near the top of the lineup throughout much of June. That's less about rewarding a hitting streak than recognizing better plate appearances. His .359 wOBA and .311 BABIP this month support what the underlying changes already suggest: he's making pitchers work under different conditions than he did just a few weeks ago. That's the value of this hitting streak. It doesn't prove Jensen has solved major league pitching. It doesn't guarantee the league won't find another weakness. It does suggest something every organization wants to see from a young hitter. When major league pitchers identified Jensen's first offensive vulnerability, he adjusted before it became part of his identity. The streak may end tomorrow. That adjustment is what Kansas City should remember.


